Stock Portfolio Organizer
The ultimate porfolio management solution.
Shares, Margin, CFD's, Futures and Forex
EOD and Realtime
Dividends and Trust Distributions
And Much More ....
WiseTrader Toolbox
#1 Selling Amibroker Plugin featuring:
Advanced Adaptive Indicators
Advanced Pattern Exploration
Neural Networks
And Much More ....
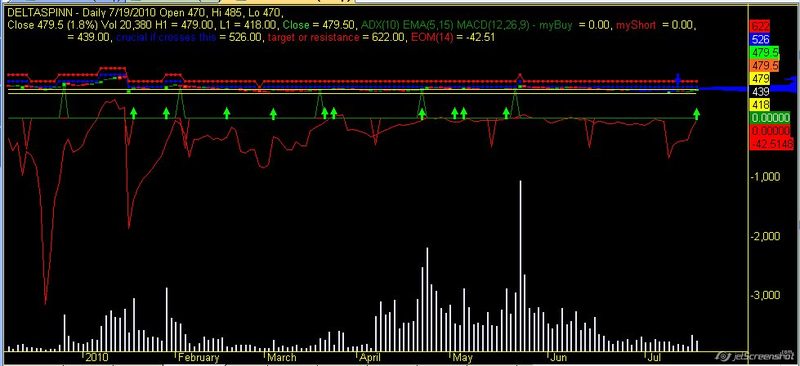
Miftha exploration for Amibroker (AFL)
Rating:
3 / 5 (Votes 3)
Tags:
amibroker, exploration
This is nice exploration or scene market. I’m test it only my trends on (dse)bangladesh you can try any other.
Screenshots
Similar Indicators / Formulas
GapUp and Bearish Close (Reversal) _Daily
Submitted
by indraji2001 almost 10 years ago
General Market Exploration by XeL
Submitted
by xel almost 12 years ago
Pattern Correlation
Submitted
by vargasc1 almost 13 years ago
Deel - Average Dollar Price Volatility
Submitted
by kaiji over 14 years ago
Wavetrend scanner
Submitted
by taxxghost over 11 years ago
10 % return by 15 day uptrend exploration
Submitted
by mayur_a14 almost 13 years ago
Indicator / Formula
Copy & Paste Friendly
_SECTION_BEGIN("exploration 1");
/*Use daily data! You could use data with
higher time resolution but then you have
to include a timeframe parameters
since 10 periods will become
10 minutes (if you have one Minute data)*/

//////////////////////////////////////////////////////////////

Filter = 1; // all symbols and quotes accepted.
DTL=140; // DTL = Define Trend Long
DTM=60;	// DTM = Define Trend Medium
DTS=8;  // DTS = Define Trend Short

//////////////////////////////////////////////////////////////

TL=LinRegSlope(MA(C, DTL),2);	 // TL = Trend Long
TM=LinRegSlope(MA(C, DTM),2);  // TM = Trend Medium
TS=LinRegSlope(MA(C, DTS),2);  // TS = Trend Short

TLL=IIf(LinRegSlope(MA(C, DTL),2) > 0,True, False);
TMM=IIf(LinRegSlope(MA(C, DTM),2) > 0,True, False);
TSS=IIf(LinRegSlope(MA(C, DTS),2) > 0,True, False);

TLLL=
WriteIf(TL>0 AND TL<0.3,"+",
WriteIf(TL>=0.3 AND TL<0.6 ,"+ +",
WriteIf(TL>=0.6,"+ + +",
WriteIf(TL<0 AND TL>-0.3,"-",
WriteIf(TL<=-0.3 AND TL>-0.6 ,"- -",
WriteIf(TL<=-0.6,"- - -",""))))));

TMMM=
WriteIf(TM>0 AND TM<0.3,"+",
WriteIf(TM>=0.3 AND TM<0.6 ,"+ +",
WriteIf(TM>=0.6,"+ + +",
WriteIf(TM<0 AND TM>-0.3,"-",
WriteIf(TM<=-0.3 AND TM>-0.6 ,"- -",
WriteIf(TM<=-0.6,"- - -",""))))));

TSSS=
WriteIf(TS>0 AND TS<0.3,"+",
WriteIf(TS>=0.3 AND TS<0.6 ,"+ +",
WriteIf(TS>=0.6,"+ + +",
WriteIf(TS<0 AND TS>-0.3,"-",
WriteIf(TS<=-0.3 AND TS>-0.6 ,"- -",
WriteIf(TS<=-0.6,"- - -",""))))));

//////////////////////////////////////////////////////////////

AddTextColumn( TLLL, "MA"+-DTL, 1 , colorDefault,
IIf( TLL==True, colorGreen, colorRed ),-1 );
AddTextColumn( TMMM, "MA"+-DTM, 1 , colorDefault,
IIf( TMM==True, colorGreen, colorRed ),-1 );
AddTextColumn( TSSS, "MA"+-DTS, 1 , colorDefault,
IIf( TSS==True, colorGreen, colorRed ),-1 );

//////////////////////////////////////////////////////////////
message=
WriteIf(TL>=0.3 AND TM>=0.3 AND
TS>=0.3, "Strong Up Trend",
WriteIf(TL<=-0.3 AND TM<=-0.3 AND
TS<=-0.3, "Strong Down Trend",
WriteIf(TLL==True AND TMM==True AND
TSS==True,"Up Trend",
WriteIf(TLL==False AND TMM==False AND
TSS==False,"Down Trend", "No Trend"))));


AddTextColumn( message, "Overall Trend", 1 ,
colorDefault,IIf(TLL==True AND TMM==True AND
TSS==True, colorGreen,
IIf(TLL==False AND TMM==False AND
TSS==False, colorRed, colorDefault )),-1 );

//////////////////////////////////////////////////////////////

x = IIf(Cross(LinRegSlope(MA(C, DTL),2),0) OR
Cross(0, LinRegSlope(MA(C, DTL),2) ), True, False);
y = BarIndex()-ValueWhen(x==True, BarIndex(),1);

Phase=WriteIf(Y>=400,"Mature",WriteIf(Y>100 AND
Y<400, "Progress", WriteIf(Y<=100, "Initial", "")));
//AddColumn( y, "Trend Phase", 1 , colorDefault,  -1);
AddTextColumn( Phase, "Trend Phase", 1 , colorDefault,  -1);

//////////////////////////////////////////////////////////////
_SECTION_END();

//  RASHEED'S BREAKOUTS
//  help requested for adding an exploration for End of Day breakouts
/*  coded by NW Trader 1-29-10 with exploration, chart signals and chart options
    toggle parameter to select between C or H & L for the breakout crossings
    toggle parameter added to remove extra trade signals
    Volume at price added
*/

_SECTION_BEGIN("BREAK OUTS");


//  ============== Standard Chart Code ============================
CodeName = "Rasheed's Breakouts";
SetFormulaName("Rasheed's Breakouts");

//   ---------------  Controls for Chart Display  ----------------------------------
SetChartOptions(0, chartShowDates | chartWrapTitle);
if (ParamToggle("Tooltip shows", "All Values|Only Prices"))
{
  ToolTip = StrFormat("Open: %g\nHigh:  %g\nLow:   %g\nClose:  %g (%.1f%%) \nVolume: " + NumToStr(V, 1), O, H, L, C, SelectedValue(ROC(C, 1)));
}

space = Param("Space on Chart", 20,  - 15, 50, 1);
GraphXSpace = space;
SetChartBkColor(ParamColor("Background Color", colorBlack));

// ================= Rasheed's original code (with Lookback and Shift default set to his specs) =================

H0 = H;
L0 = L;
C0 = C;
O0 = O;

Lookback = Param("LookBack", 10, 10, 50, 1); // Default for interday commodity currency trading
shift = Param("Shift", 5, 1, 50, 1); // ?
x0 = LastValue(Cum(1));
x1 = x0 - shift;
H = Ref(H,  - shift + 1);
L = Ref(L,  - shift + 1);
H1 = LastValue(Ref(HHV(H, Lookback),  - 1));
L1 = LastValue(Ref(LLV(L, Lookback),  - 1));

Plot(H1, "H1", colorYellow);
Plot(L1, "L1", colorYellow);

H = H0;
L = L0;
C = C0;
O = O0;

up = Cross(H, H1)AND Cum(1) > x1;
dn = Cross(L1, L)AND Cum(1) > x1;

Plot(C, "Close", IIf(Cum(1) > x1 - Lookback AND Cum(1) <= x1, colorBlue, IIf(Up, colorBrightGreen, IIf(Dn, colorRed, IIf(C > O, colorGreen, colorRed)))), 64);
PlotShapes(shapeDownArrow *(Cum(1) == x1 + 1), colorBlue);

// ======================= Exploration and Signal Code =================
TRIGGER = ParamToggle("Trigger ", "CLOSE|HIGH OR LOW");


XH1 = Cross(C, H1);
XL1 = Cross(L1, C);
XH2 = Cross(H, H1);
XL2 = Cross(L1, L);

if (TRIGGER == 0)
{
  Buy = XH1;
  Sell = XL1;
}

else
{
  Buy = XH2;
  Sell = XL2;
}


TradeDisplay = ParamToggle("Remove Extra Trades?", "No|Yes");

if(TradeDisplay != 0){
	Buy = ExRem(Buy, Sell);
  	Sell = ExRem(Sell, Buy); // THIS WILL REMOVE EXESS SIGNALS ON A CHART OR IN AN EXPLORATION
}

Filter = Buy OR Sell;
Action = WriteIf(Buy, "BUY", WriteIf(Sell, "SELL", "   "));

AddTextColumn(IndustryID(1), "Industry Sector  ", 30.0, colorBlue, colorYellow);
AddColumn(C, "Last ", 2.2, colorWhite, colorBlue);
AddTextColumn(Action, "Action", 8.0, IIf(XH1, colorDarkGreen, colorDarkRed), colorWhite);
AddColumn(IIf(XH1, H1, L1), "BREAKOUT LEVEL", 3.2, colorYellow, IIf(XH1, colorDarkGreen, colorDarkRed));

// -----------------------------------------------------------------------------------  Arrow signals --- FOR TRADES  ----------------------------------------------------------
PlotShapes(Buy *shapeUpArrow, colorBrightGreen, 0, L /* ENTRY_TRAILARRAY */,  - 30);
PlotShapes(Sell *shapeDownArrow, colorLightYellow, 0, H,  - 30);
_SECTION_END();


_SECTION_BEGIN("Volume At Price");
PlotVAPOverlay(Param("Lines", 1000, 100, 1000, 10), Param("Width", 15, 1, 100, 1), ParamColor("Color", colorBlue), ParamToggle("Side", "Left|Right", 1) | 4 *ParamToggle("Z-order", "On top|Behind", 1));

_SECTION_END();

_SECTION_BEGIN("ADX + EMA + MACD");
// This combines three indicators into one timing Signal
//function ParamOptimize( description, default, minv, maxv, step )
//    { return Optimize(description, Param(description,default, minv, maxv, step ), minv, maxv, step ); }
tgl = ParamToggle("Result", "AND logic|Compare");
// ema
emaPrice = ParamField("Ema Price field", 3);
PeriodShort = Param("Ema Short Periods", 5, 2, 20, 1);
PeriodLong = Param("Ema Long Periods", 15, 2, 100, 1);
pS = EMA(emaPrice , PeriodShort);
pL = EMA(emaPrice , PeriodLong);
upEma = IIf(pS > pL, 1, 0);  // fast ema is above slow, long condition
// adx di lines
range = Param("ADX Periods", 10, 2, 200, 1 );
myPdi = PDI(range );
myMdi = MDI(range );
upAdx = IIf( myPdi > myMdi, 1, 0);
// macd
r1 = Param( "Macd Fast avg", 12, 2, 200, 1 );
r2 = Param( "Macd Slow avg", 26, 2, 200, 1 );
r3 = Param( "Macd Signal avg", 9, 2, 200, 1 );
myMacd = MACD(r1,r2);
mySignal = Signal(r1,r2,r3);
upMacd = IIf(myMacd  > mySignal, 1, 0);
// switch test calculation and compare the results
if(tgl)
{
myBuy = upEma AND upAdx  AND upMacd;
myShort = !upEma AND !upAdx AND !upMacd;
}
else
{
myBuy = IIf(pS > pL AND myMacd > mySignal AND myPdi > myMdi,1,0);
myShort = IIf(pS < pL AND myMacd < mySignal AND myPdi < myMdi,1,0);
}
Buy = Cover = ExRem(myBuy, myShort);
Short = Sell = ExRem(myShort, myBuy);
Plot( Buy * C, "ADX(" + NumToStr(range,1.0) + ") EMA(" + NumToStr(PeriodShort,1.0) + "," + NumToStr(PeriodLong,1.0) +
 ") MACD(" + NumToStr(r1,1.0) + "," + NumToStr(r2,1.0) + "," + NumToStr(r3,1.0) + ") - myBuy ",  colorGreen); // a positive spike that indicates a buy or cover trade.
Plot( -Short * C , "myShort ", colorRed);
// exploration
Filter = Buy OR Short;
AddColumn(Close, "Close", 1.2);
AddColumn(Buy, "Buy", 1.0);
AddColumn(Short, "Short",1.0);
_SECTION_END();

//gann level plotter developed by engr.sameer@gmail.com//

_SECTION_BEGIN("Price");
SetChartOptions(0,chartShowArrows|chartShowDates);
_N(Title = StrFormat("{{NAME}} - {{INTERVAL}} {{DATE}} Open %g, Hi %g, Lo %g,
Close %g (%.1f%%) Vol " +WriteVal( V, 1.0 ) +" {{VALUES}}", O, H, L, C,
SelectedValue( ROC( C, 1 )) ));
Plot( C, "Close", ParamColor("Color", colorOrange ), styleNoTitle |
ParamStyle("Style") | GetPriceStyle() );

//gann breakout formula
YH=HHV(Close,365);
YEL=LLV(Close,365);
YCENTRE=(YH+YEL)/2;
yhov=IIf(Close>ycentre,yEL,yel);
g1=sqrt(yEL);
x1=Param("GANN MULTIPLIER",2,0.5,5,0.5);
L0=floor((g1-1*X1)^2);
L1=floor((g1-0*x1)^2);
L2=floor((g1+1*x1)^2);
L3=floor((g1+3*x1)^2);
L4=floor((g1+4*x1)^2);
L5=floor((g1+5*x1)^2);
L6=floor((g1+6*x1)^2);
L7=floor((g1+7*x1)^2);
L8=floor((g1+8*x1)^2);
L9=floor((g1+9*x1)^2);
L10=floor((g1+10*x1)^2);
L11=floor((g1+11*x1)^2);
L12=floor((g1+12*x1)^2);
L13=floor((g1+13*X1)^2);
L14=floor((g1+14*X1)^2);
L15=floor((g1+15*X1)^2);
L16=floor((g1+16*X1)^2);
L17=floor((g1+17*X1)^2);
L18=floor((g1+18*X1)^2);
L19=floor((g1+19*X1)^2);
L20=floor((g1+20*X1)^2);

Cx=C+0.12345;
//choosing the current levels//
x=IIf(Cx>L0 AND cx<L1,L0,IIf(cx>L1 AND cx<L2,L1,IIf(cx>L2 AND
cx<L3,L2,IIf(cx>L3 AND cx<L4,L3,IIf(cx>L4 AND cx<L5,L4,IIf(cx>L5 AND
cx<L6,L5,IIf(cx>L5 AND cx<L7,L6,IIf(cx>L7 AND cx<L8,L7,IIf(cx>L8 AND
cx<L9,L8,IIf(cx>L9 AND cx<L10,L9,IIf(cx>L10 AND cx<L11,L10,IIf(cx>L11 AND
cx<L12,L11,IIf(cx>L12 AND cx<L13,L12,IIf(cx>L13 AND cx<L14,L13,IIf(cx>L14 AND
cx<L15,L14,IIf(cx>L15 AND cx<L16,L15,IIf(cx>L16 AND cx<L17,L16,IIf(cx>L17 AND
cx<L18,L17,IIf(cx>L18 AND cx<L19,L18,IIf(cx>L19 AND
cx<L20,L19,L20))))))))))))))))))));
p=IIf(x==L0,L0,IIf(x==L1,L1,IIf(x==L2,L2,
IIf(x==L3,L3,IIf(x==L4,L4,IIf(x==L5,L5, IIf(x==L6,L6 ,IIf(x==L6,L6 ,
IIf(x==L7,L7 ,IIf(x==L8,L8 ,IIf(x==L9,l9,IIf(x==L10,L10
,IIf(x==L11,L11,IIf(x==L12,L12,IIf(x==L13,L13,IIf(x==L14,L14,IIf(x==L15,L15,IIf(x==L16,L16,IIf(x==L17,L17,IIf(x==L18,L18,IIf(x==L19,L19,IIf(x==L20,L20,L20))))))))))))))))))))));
q=IIf(x==L0,L1,IIf(x==L1,L2,IIf(x==L2,L3,
IIf(x==L3,L4,IIf(x==L4,L5,IIf(x==L5,L6, IIf(x==L6,L7 ,IIf(x==L6,L8 ,
IIf(x==L7,L8 ,IIf(x==L8,L9 ,IIf(x==L9,L10,IIf(x==L10,L11
,IIf(x==L11,L12,IIf(x==L12,L13,IIf(x==L13,L14,IIf(x==L14,L15,IIf(x==L15,L16,IIf(x==L16,L17,IIf(x==L17,L18,IIf(x==L18,L19,IIf(x==L19,L20,IIf(x==L20,L20,L20))))))))))))))))))))));
r=IIf(x==L0,L2,IIf(x==L1,L3,IIf(x==L2,L4,
IIf(x==L3,L5,IIf(x==L4,L6,IIf(x==L5,L7, IIf(x==L6,L8 ,IIf(x==L6,L9 ,
IIf(x==L7,L9 ,IIf(x==L8,L10 ,IIf(x==L9,L11,IIf(x==L10,L12
,IIf(x==L11,L13,IIf(x==L12,L14,IIf(x==L13,L15,IIf(x==L14,L16,IIf(x==L15,L17,IIf(x==L16,L18,IIf(x==L17,L19,IIf(x==L18,L20,IIf(x==L19,L20,IIf(x==L20,L20,L20))))))))))))))))))))));

//plotting section//
Plot(p,"support if falls below",colorBlack,styleDots);
Plot(q,"crucial if crosses this",colorBlue,styleDots);
Plot(r,"target or resistance",colorRed,styleDots);
//Plot((r-((r-q)/2)),"intermediatelevel",colorLightGrey,styleDots);
//Plot((p+((q-p)/2)),"intermediatelevel2",colorLightGrey,styleDots);


_SECTION_BEGIN("Volume");
Plot( Volume, _DEFAULT_NAME(), ParamColor("Color", colorLavender ),
styleNoTitle | ParamStyle( "Style", styleHistogram | styleOwnScale | styleThick
| styleNoLabel, maskHistogram  ), 2 );
_SECTION_END();

_SECTION_BEGIN("EOM");
function EaseOfMovement(Period)
{
  MidPointMove  = ( H + L ) / 2  -  Ref( ( H + L ) / 2, -1 );
  Vadj = Volume / 10000;
  BoxRatio = VAdj / ( 8 * ( H - L ) );
  return EMA( MidPointMove / BoxRatio, Period );
}

Plot( EaseOfMovement( Param("Period", 14, 2, 100 ) ), _DEFAULT_NAME(), ParamColor("Color", ColorCycle ) );
_SECTION_END();
0 comments
Leave Comment
Please login here to leave a comment.
Back