Stock Portfolio Organizer
The ultimate porfolio management solution.
Shares, Margin, CFD's, Futures and Forex
EOD and Realtime
Dividends and Trust Distributions
And Much More ....
WiseTrader Toolbox
#1 Selling Amibroker Plugin featuring:
Advanced Adaptive Indicators
Advanced Pattern Exploration
Neural Networks
And Much More ....
The Quest For Reliable Crossovers for Amibroker (AFL)
Rating:
3 / 5 (Votes 8)
Tags:
trading system, amibroker, moving average
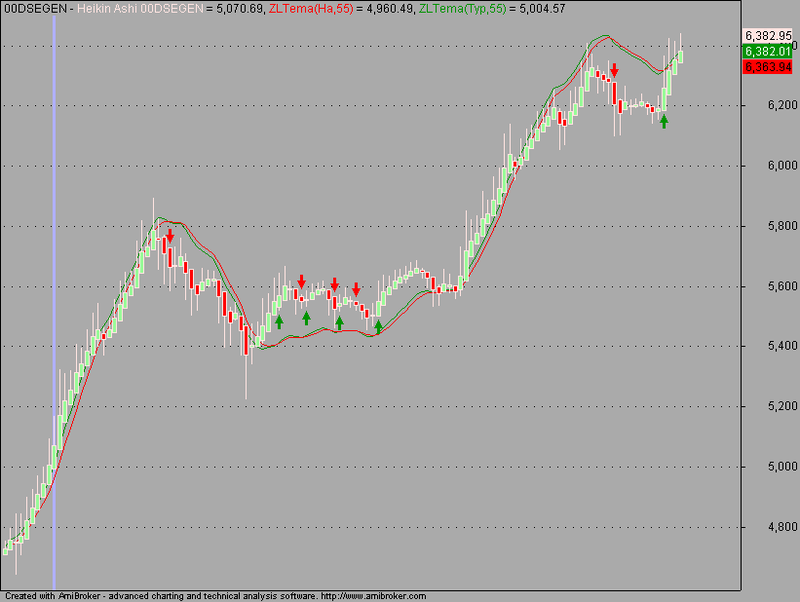
when faster moving average positively crosses the slower moving average then candlestick become green and instantly buy signal generated by the afl and similarly sell signal given when it is negative…..
Screenshots
Similar Indicators / Formulas
Super TEMA
Submitted
by HARI123 over 13 years ago
Debdulal And Soumya
Submitted
by siivaramm over 13 years ago
Guppy With KBrain Trending with Buy Sell Exploration
Submitted
by kv_maligi almost 12 years ago
70/1030 EMA CROSSOVER WITH TRAILING STOPLOSS
Submitted
by richjohn almost 14 years ago
Moving Average Difference
Submitted
by rananjay00007 about 14 years ago
1453 Fatih
Submitted
by acarlar33 almost 11 years ago
Indicator / Formula
Copy & Paste Friendly
_SECTION_BEGIN("The Quest For Reliable Crossovers");
function ZeroLagTEMA( array, period )
{
 TMA1 = TEMA( array, period );
 TMA2 = TEMA( TMA1, period );
 Diff = TMA1 - TMA2;
 return TMA1 + Diff ;
}
/////////////////////
// Heikin-Ashi code
HaClose = (O+H+L+C)/4;
HaOpen = AMA( Ref( HaClose, -1 ), 0.5 );
HaHigh = Max( H, Max( HaClose, HaOpen ) );
HaLow = Min( L, Min( HaClose, HaOpen ) );
// Velvoort is using not original, but modified Heikin-Ashi close
HaClose = ( HaClose + HaOpen + HaHigh + HaLow )/4;
// you can switch between Heikin-Ashi chart and regular candlestick chart
if( ParamToggle("Plot Heikin-Ashi", "No,Yes", 1 ) )
   PlotOHLC( HaOpen, HaHigh, HaLow, HaClose, "Heikin Ashi " + Name(), colorRose, styleCandle );
else
   Plot( C, "Regular candles " + Name(), colorRose, styleCandle );
period = Param("Avg. TEMA period", 55, 1, 100 );
ZLHa = ZeroLagTEMA( HaClose, period );
ZLTyp = ZeroLagTEMA( Avg, period );
Plot( ZLHa, "ZLTema(Ha,"+period+")", colorRed );
Plot( ZLTyp, "ZLTema(Typ,"+period+")", colorGreen );
Buy = Cross( ZLTyp, ZLHa );
Sell = Cross( ZLHa, ZLTyp );
PlotShapes( shapeUpArrow * Buy, colorGreen, 0, HaLow );
PlotShapes( shapeDownArrow * Sell, colorRed, 0, HaHigh );
_SECTION_END();
1 comments
1.
siht_that
True Relibel One..
Report as Spam
Leave Comment
Please login here to leave a comment.
Back