Stock Portfolio Organizer
The ultimate porfolio management solution.
WiseTrader Toolbox
#1 Selling Amibroker Plugin featuring:
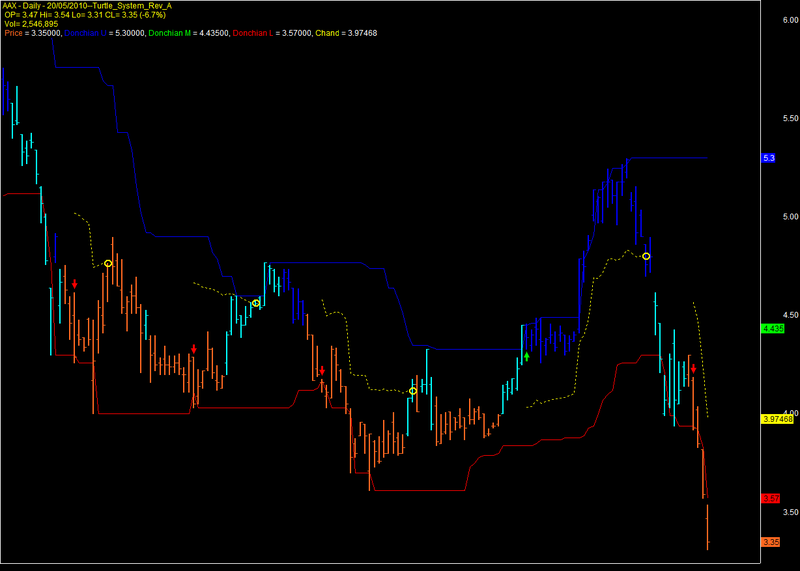
Turtle Trading System Revision A for Amibroker (AFL)
Hi,
I came across with this post No. 1191 by Karthik
Since we don’t have this afl in our library I thought it to share it with all.
(For convenience of display, I have changed the color codes, without disturbing the original code. One can download the original code from the above site.)
Trend trading system.
Strengths: volatility-based.
Weaknesses: lag and since volatility increases at the end of a trend, traders exits early.
Description: Indicator is used to keep track of a trade. Once a stop is hit, it waits for the next entry signal (short or long). Use on DAILY values only.
Algorithm: Lebeau recommends that an exits hangs from the HHV (long) or LLV (short) since the trade was triggered. Some traders use the highest close as the base for hanging the exit.
cnbondre
Screenshots
Similar Indicators / Formulas
Indicator / Formula
/*
Author: DrZingaro
E-mail: drzingaro@gmail.com

Turtle trading experimemnt Chandelier exit based on Chuck Lebeau's work
*/
//=============================SETUP================ ======================

pds = 20;
MAFAST = EMA( Close, 20 );
MASLOW = EMA( Close, 40 );

DonchianUpper = HHV( Ref( H, -1 ), pds ); // Highest high value of highs in last 20 periods
DonchianLower = LLV( Ref( L, -1 ), pds ); // Lowest low value of low in last 20 periods
DonchianMiddle = ( DonchianUpper + DonchianLower ) / 2;

UpTrend = C > ( LLV( L, 20 ) + 2 * ATR( 10 ) ) AND EMA( Close, 20 ) > EMA( Close, 40 );
DnTrend = C < ( HHV( H, 20 ) - 2 * ATR( 10 ) ) AND EMA( Close, 20 ) < EMA( Close, 40 );
Color = IIf( UpTrend, colorBlue, IIf( DnTrend, colorOrange, colorCustom11 ) );

// Plots a 20 period Donchian channel
Plot( C, "Price", Color, styleBar | styleThick );
Plot( DonchianUpper, "Donchian U", ParamColor( "DU Color", colorBlue ), ParamStyle( "DU Style", styleLine ) );
Plot( DonchianMiddle, "Donchian M", ParamColor( "DM Color", colorBrightGreen ), ParamStyle( "DM Style", styleNoLine ) );
Plot( DonchianLower, "Donchian L", ParamColor( "DL Color", colorRed ), ParamStyle( "DL Style", styleLine ) );

Title = WriteVal( DonchianUpper, 1.2 ) + WriteVal( DonchianLower, 1.2 ) + WriteVal( DonchianMiddle, 1.2 );
//=============================TRIGGERS AND ENTRIES=======================
Buy = High > Ref( HHV( High, 20 ), -1 ) AND MAFAST > MASLOW; // Enters long trade

Short = Low < Ref( LLV( Low, 20 ), -1 ) AND MAFAST < MASLOW; // Enters short trade


//=============================EXITS================ ======================
_SECTION_BEGIN( "Chandelier Exit" );

SetBarsRequired( 50, 50 );

Multiple = Param( "Multiple", 3, 0.5, 10, 0.1 ); // How many ATR’s to be allowed below the highest high since latest "buy" bar
ATRPeriods = Param( "ATR Periods", 20, 1, 50, 1 ); // How many periods to use for the ATR

stopArray = Null;
atrArray = ATR( ATRPeriods );
HHArray = Null;
LLArray = Null;
exitArray = Null;
trendDirection = 0;

for ( i = 0; i < BarCount; i++ )
{
    if ( Short[i] )
    {
        // we just triggered a short trade. Set up starting values
        stopArray[i] = Low[i] + ( Multiple * atrArray[i] );
        LLArray[i] = Low[i]; // initialize the lowest low array
        trendDirection = 0 - 1; // going short. Base bar.
    }

    if ( Buy[i] )
    {
        // we just triggered a long trade. Set up starting values
        stopArray[i] = High[i] - ( Multiple * atrArray[i] );
        HHArray[i] = High[i]; // initialize the highest high array
        trendDirection = 1; // going long. Base bar flag is now set.
    }

    exitArray[i] = 0;

    if ( trendDirection > 0 )
    {
        // keep track of the highest high, highest close, highest low, etc..
        if ( trendDirection > 1 )
        {
            // We are in the trade (2nd day or later)
            if ( Low[i] < stopArray[i-1] )
            {
                //stop got hit. Reset the trade.
                trendDirection = 0; // OK. wait until we trigger another trade.
                exitArray[i] = 1;
            }
            else
            {
                // keep track of the HHV since trade was entered.
                if ( High[i] > HHArray[i-1] )
                    HHArray[i] = High[i];
                else
                    HHArray[i] = HHArray[i-1];

                // Compute the stop based on the HHV.
                stopArray[i] = HHArray[i] - ( Multiple * atrArray[i] );
            }
        }

        trendDirection = trendDirection + 1;
    }

    if ( trendDirection < 0 )
    {
        // keep track of the lowest low, lowest close, lowest high, etc..
        if ( trendDirection < 0 - 1 )
        {
            // We are in the trade (2nd day or later)
            if ( High[i] > stopArray[i-1] )
            {
                // our stop got hit. Reset the trade.
                trendDirection = 0;
                exitArray[i] = 0 - 1;
            }
            else
            {
                // keep track of the LLV since trade was entered.
                if ( Low[i] < LLArray[i-1] )
                    LLArray[i] = Low[i];
                else
                    LLArray[i] = LLArray[i-1];

		// Compute the stop based on the LLV.
                stopArray[i] = LLArray[i] + ( Multiple * atrArray[i] );
            }
        }

        trendDirection = trendDirection - 1;
    }

    if ( trendDirection == 0 )
    {
        stopArray[i] = 0;
        LLArray[i] = 0;
        HHArray[i] = 0;
    }
}

Sell = Cover = exitarray;

Buy = ExRem( Buy, Sell );
Sell = ExRem( Sell, Buy );
Short = ExRem( Short, Cover );
Cover = ExRem( Cover, Short );

PlotShapes( Buy*shapeUpArrow, colorBrightGreen, 0, Low );
PlotShapes( Short*shapeDownArrow, colorRed, 0, High );
PlotShapes( abs( exitArray )*shapeHollowCircle, colorYellow, 0, ValueWhen( stopArray, stopArray, 1 ), 0 );
Plot( stopArray, "Chand", ParamColor( "Chand Color:", colorYellow ), ParamStyle( "Chand Style", styleDashed ) );

_N( Title = EncodeColor( colorYellow ) + StrFormat( "{{NAME}} - {{INTERVAL}} - {{DATE}}--Turtle_System_Rev_A \n OP= %g Hi= %g Lo= %g CL= %g (%.1f%%) \n Vol= " + WriteVal( V, 1.0 ) + "\n" + " {{VALUES}}", O, H, L, C, SelectedValue( ROC( C, 1 ) ) ) );//=cnb

//_N(Title = "LLArray: " + LLArray + ", HHArray:" + HHArray +", stopArray"+stopArray);

//PlotShapes(shapeCircle * Sell, colorRed);
//PlotShapes(shapeCircle * Cover, colorGreen);
_SECTION_END();
2 comments
Leave Comment
Please login here to leave a comment.
Back
Thanks!
This one tested on SPY with +ve result.
It seems that the formula references FUTURE quotes.
If you backtest this system you may receive outstanding results
that CAN NOT be reproduced in real trading.
100000 data bars used during this check. Total execution time: 0.186486 sec.
Approximately 151 past and 50 future quotes are needed to calculate the formula properly
(This statement is automated rough estimate and does not take into account functions exported by plugins or scripting parts of your formula)