Stock Portfolio Organizer
The ultimate porfolio management solution.
Shares, Margin, CFD's, Futures and Forex
EOD and Realtime
Dividends and Trust Distributions
And Much More ....
WiseTrader Toolbox
#1 Selling Amibroker Plugin featuring:
Advanced Adaptive Indicators
Advanced Pattern Exploration
Neural Networks
And Much More ....
RSI over Price with Volume for Amibroker (AFL)
Rating:
3 / 5 (Votes 4)
Tags:
oscillator, amibroker
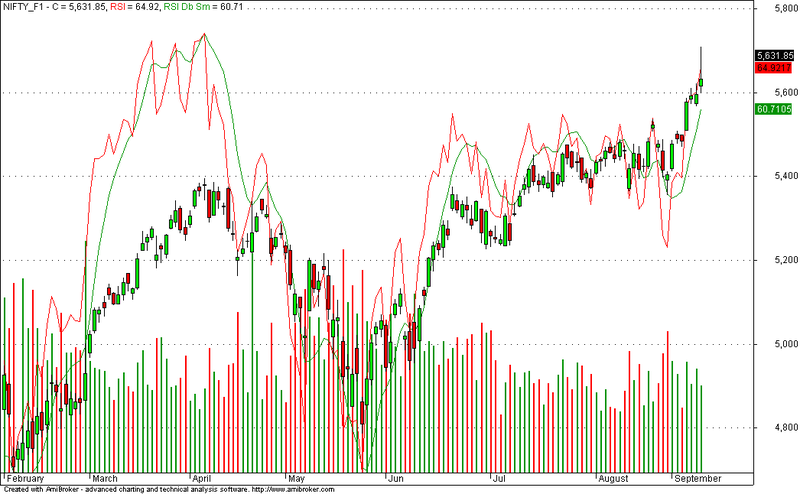
Modified RSI plotted over price with Volume indication for EOD datas. Whenever Red line crosses Green line from bottom, Buy signal is initiated & vice-versa for Sell signal. Also you can find reversal level for next trading day by using “Quote editor” manually add close values for next day. Keep altering values till make new crossover of Red & green lines. That value will became reversal level.
Screenshots
Similar Indicators / Formulas
Febo RSI ..real indicator
Submitted
by abhinavsingh over 12 years ago
Trading Volume Statistic
Submitted
by tuanstock1 almost 10 years ago
Ergodic Oscillator
Submitted
by dljtrader over 13 years ago
3 Days Track
Submitted
by janet0211 almost 14 years ago
Chande Momentum Oscillator
Submitted
by klimpek over 13 years ago
BoH Risk Aversion Indicator
Submitted
by genkumag over 12 years ago
Indicator / Formula
Copy & Paste Friendly
_SECTION_BEGIN("RSI over price");

// RSI.afl
//
dd = RSIa( C, 20);
ee = EMA( dd, 3 );
ff = EMA( ee, 5 );
Plot( C, "C", colorBlack, styleCandle );
Plot( dd, "RSI", colorRed, styleLine | styleOwnScale );
//Plot( ee, "RSI Sm", colorBlue, styleLine | styleOwnScale );
Plot( ff, "RSI Db Sm", colorGreen, styleLine | styleOwnScale );
_SECTION_END();


_SECTION_BEGIN("Volume");
Plot( Volume, _DEFAULT_NAME(), IIf( C >= Ref(C,-1), ParamColor("Up Color", colorGreen ), ParamColor("Down Color", colorRed ) ), styleNoTitle | ParamStyle( "Style", styleHistogram | styleOwnScale | styleThick | styleNoLabel, maskHistogram  ), 2 );
P = ParamField("Volume field",5);
Periods = Param("Periods", 5, 5, 200, 1, 5 );
VMA = MA( Volume, Periods );
//Plot( VMA, _DEFAULT_NAME(), ParamColor( "Color", colorYellow ), ParamStyle("Style", styleLine | styleNoRescale),2 );
_SECTION_END();
3 comments
Leave Comment
Please login here to leave a comment.
Back
Modified RSI with EMAS. Also added Buy and Sell indication. Suitable for EOD datas
Nice one
good