Stock Portfolio Organizer
The ultimate porfolio management solution.
Shares, Margin, CFD's, Futures and Forex
EOD and Realtime
Dividends and Trust Distributions
And Much More ....
WiseTrader Toolbox
#1 Selling Amibroker Plugin featuring:
Advanced Adaptive Indicators
Advanced Pattern Exploration
Neural Networks
And Much More ....
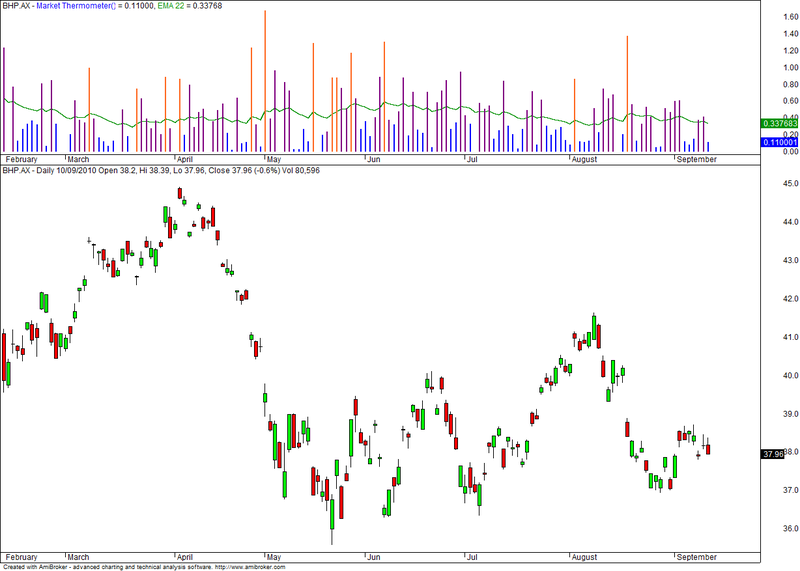
market thermometer for Amibroker (AFL)
Rating:
2 / 5 (Votes 3)
Tags:
amibroker, volume
You need to use this indicator below your price graph for good results.
Screenshots
Similar Indicators / Formulas
New V spiker Moded-1.50
Submitted
by Kutubi over 12 years ago
Smoothed OBV
Submitted
by magic almost 14 years ago
Volume Scan report
Submitted
by anandnst over 11 years ago
Better Volume Indicator
Submitted
by kaiji over 14 years ago
Volume Color with Dynamic Limit
Submitted
by kaiji about 14 years ago
Controlling Height of Volume Bars
Submitted
by kaiji about 14 years ago
Indicator / Formula
Copy & Paste Friendly
_SECTION_BEGIN("Market Thermometer");

H1 = Ref(H, -1);
L1 = Ref(L, -1);

T = IIf(H<H1 AND L>L1, 0, IIf(H-H1>L1-L, H-H1, L1-L));

Val1 = H-H1;
Val2 = L1-L;
Val = IIf(Val1>Val2, Val1, Val2) ;


Avgval = Median(Val, 22);

color= IIf (Val < Avgval, colorBlue, IIf(Val >= Avgval AND Val < Avgval * 3, colorViolet, IIf(Val > Avgval * 3, colorOrange, colorViolet)));


Plot(T, _DEFAULT_NAME(), color, styleHistogram | styleThick);
P = ParamField("Price field",-1);
Periods = Param("Periods", 22, 2, 200, 1, 10 );

Plot( EMA( P, Periods ), "EMA 22", colorGreen, styleThick);

_SECTION_END();
1 comments
Leave Comment
Please login here to leave a comment.
Back
Hai, Good Color, but how to use ?, each color indicate ?? pls