Stock Portfolio Organizer
The ultimate porfolio management solution.
Shares, Margin, CFD's, Futures and Forex
EOD and Realtime
Dividends and Trust Distributions
And Much More ....
WiseTrader Toolbox
#1 Selling Amibroker Plugin featuring:
Advanced Adaptive Indicators
Advanced Pattern Exploration
Neural Networks
And Much More ....
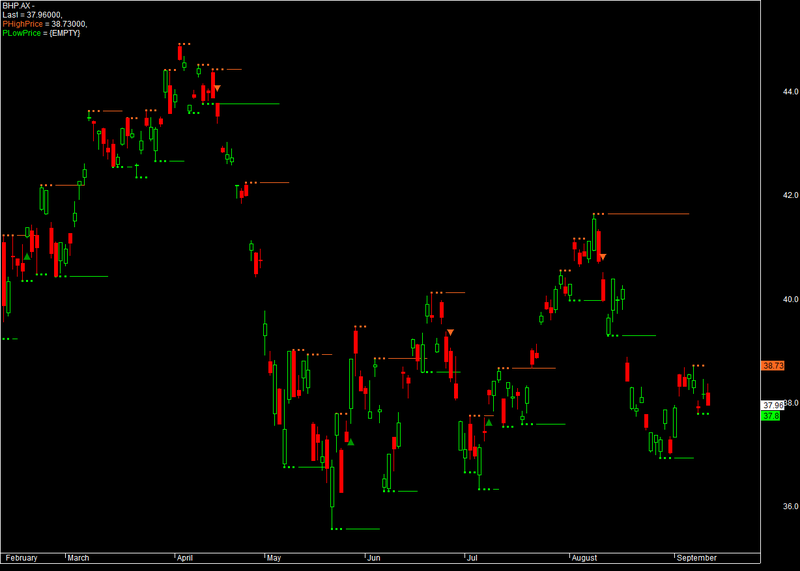
Peak & Valley for Amibroker (AFL)
Rating:
4 / 5 (Votes 11)
Tags:
trading system, amibroker, pivots
I found this AFL on tatechnics site of Karthik Marar
It has apparently been created by Edward and posted on the site by Karma8 – All credits to the three for the post
Dear Admin – Please caution if the formula looks into the future
Screenshots
Similar Indicators / Formulas
Kenzie_SR_Modified
Submitted
by vargasc1 over 12 years ago
T3 function cloud
Submitted
by ahmmad almost 13 years ago
Lakshmi buy sell signals
Submitted
by rani over 13 years ago
MPLite--KAKA & Heinkin Ashi & NickMA
Submitted
by pharaoh over 13 years ago
Pivot Trading by Karhikmarar
Submitted
by THE LORD KSA about 14 years ago
Indicator / Formula
Copy & Paste Friendly
_SECTION_BEGIN("Peak & Valley");
// E.M.Pottasch 09/06/10
nbar = Param("nbar",2,1,5,1);

PHigh = H > Ref(HHV(H,nbar),-1) AND Ref(HHV(H,nbar),nbar) < H;
PHighPrice0 = ValueWhen(PHigh,H);
PHighPrice1 = IIf(PHighPrice0 AND BarsSince(PHigh) > nbar,PHighPrice0,Null);
PHighPrice2 = IIf(PHighPrice0 AND BarsSince(PHigh) <= nbar,PHighPrice0,Null);
PLow = L < Ref(LLV(L,nbar),-1) AND Ref(LLV(L,nbar),nbar) > L;
PLowPrice0 = ValueWhen(PLow,L);
PLowPrice1 = IIf(PLowPrice0 AND BarsSince(Plow) > nbar,PLowPrice0,Null);
PLowPrice2 = IIf(PLowPrice0 AND BarsSince(Plow) <= nbar,PLowPrice0,Null);

GraphXSpace = 5;
SetChartOptions(0, chartShowDates);
Plot(C,"\nLast",colorWhite,styleCandle);

Plot(PHighPrice1,"\nPHighPrice",colorOrange,styleThick);
Plot(PHighPrice2,"",colorOrange,styleDots | styleNoLine);
Plot(PLowPrice1,"\nPLowPrice",colorBrightGreen,styleThick);
Plot(PLowPrice2,"",colorBrightGreen,styleDots | styleNoLine);

Buy=H>PHighPrice0;
Sell=L<PLowPrice0;

Buy=ExRem(Buy,Sell);
Sell=ExRem(Sell,Buy);

PlotShapes(IIf(Buy , shapeSmallUpTriangle, shapeNone) ,colorGreen, 0,L,-30);
PlotShapes(IIf( Sell, shapeSmallDownTriangle, shapeNone) ,colorOrange, 0,H,-25);
_SECTION_END();
10 comments
Leave Comment
Please login here to leave a comment.
Back
Very good!
Very efficient!
Thank You!
SEEN SAME TYPE OF AFL CREATED BY PRAKASH SHENOI SOMEWERE ELSE, VERY GOOD AFL FOR INTRADAY TRADES/SWING TRADES.KARTHIK BHAI NAME IS ENOUGH FOR QUALITY AFL THANKS FOR THIS.
Very good AFL. Thanks for sharing
This will not be displayed in real time.
How can we use this for trading? Can someone explain for the forum ?
Thanks,
Gopal
gopal you can use this indicator to look at support and resistance, so you can find breakout or breakdown easily.
very good
thanx
Thanks To Edward and karthick
back test Great
very good
PLEASE ADD LATEST TWO TRENDLINES ONE UP AND ONE DOWN….GRATEFUL TO YOU