Stock Portfolio Organizer
The ultimate porfolio management solution.
Shares, Margin, CFD's, Futures and Forex
EOD and Realtime
Dividends and Trust Distributions
And Much More ....
WiseTrader Toolbox
#1 Selling Amibroker Plugin featuring:
Advanced Adaptive Indicators
Advanced Pattern Exploration
Neural Networks
And Much More ....
SAR in multiple timeframe for Amibroker (AFL)
Rating:
3 / 5 (Votes 2)
Tags:
trading system, amibroker, sar
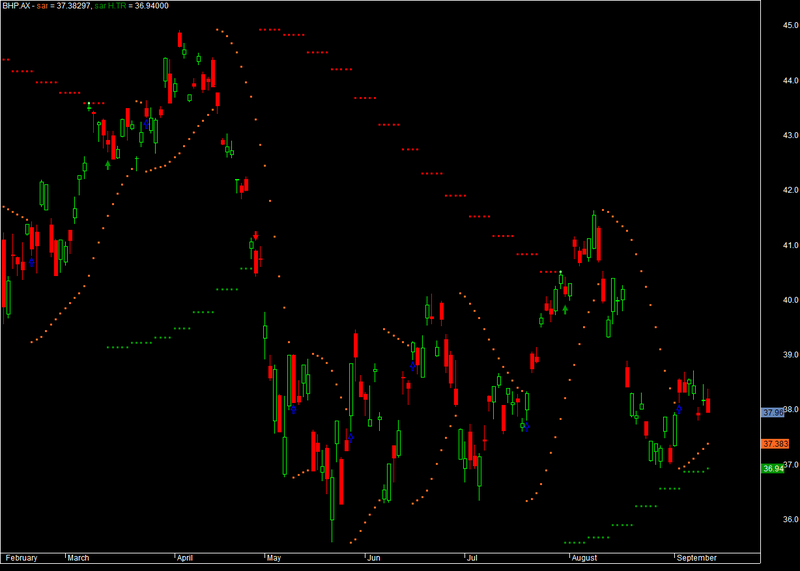
Interesting modification which allows viewing of daily and weekly status of SAR on same chart
Screenshots
Similar Indicators / Formulas
Parabolic Sar Crossover Trading System
Submitted
by trinag about 11 years ago
Behgozin slope finder modified
Submitted
by richuw over 11 years ago
Kase CD V2batu
Submitted
by batu1453 over 9 years ago
Ichimoku
Submitted
by prashantrdx almost 10 years ago
Three-Bar Inside Bar Pattern
Submitted
by EliStern about 13 years ago
Intraday Indicator
Submitted
by sudhasp about 13 years ago
Indicator / Formula
Copy & Paste Friendly
_SECTION_BEGIN("SAR in multitimeframe");

Plot(C,"",3,64);

A1=SAR(0.02,0.2);
Cond3=Cross(C,A1);
Cond4=Cross(A1,C);
Plot(A1, "sar", colorOrange, 24 );
PlotShapes(Cond3*shapeHollowUpArrow,colorBlue,0,L,-10);
PlotShapes(Cond4*shapeHollowDownArrow,colorBlack,0,H,-10);


TimeFrameSet(inWeekly);
A=SAR(0.02,0.2);
TimeFrameRestore();
K = TimeFrameExpand(A, inWeekly);
Cond1=Cross(C,K);
Cond2=Cross(K,C);
col = IIf(K < L,colorGreen,IIf(K > H,colorRed,colorWhite));
Plot(K, "sar H.TR", col, 24 );
PlotShapes(Cond1*shapeUpArrow,colorGreen,0,L,-20);
PlotShapes(Cond2*shapeDownArrow,colorRed,0,H,-20);

Buy=Cond1 AND Cond3;
Sell=Cond2 AND Cond4;
Buy=ExRem(Buy,Sell);
Sell=ExRem(Sell,Buy);
PlotShapes(Buy*shapeUpTriangle,colorGreen,0,L,-35);
PlotShapes(Sell*shapeDownTriangle,colorRed,0,H,-35);
_SECTION_END();
0 comments
Leave Comment
Please login here to leave a comment.
Back