Stock Portfolio Organizer
The ultimate porfolio management solution.
Shares, Margin, CFD's, Futures and Forex
EOD and Realtime
Dividends and Trust Distributions
And Much More ....
WiseTrader Toolbox
#1 Selling Amibroker Plugin featuring:
Advanced Adaptive Indicators
Advanced Pattern Exploration
Neural Networks
And Much More ....
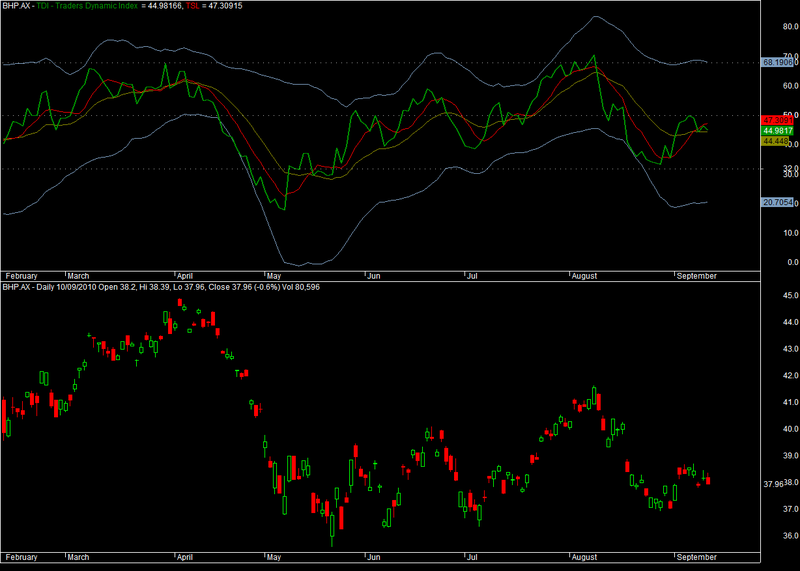
Dynamic Traders Index for Amibroker (AFL)
Rating:
3 / 5 (Votes 5)
Tags:
oscillator, amibroker
Another interesting adaption I found by Karma on karthik’s site
Blue bands show a strength of the trend — the wider they are, the stronger is the trend.
Yellow line indicates the trend’s direction change — when it bounces of 32 level, trend goes bullish, when it bounces down from 68 level, trend goes bearish.
Green and red lines Signal for the long position — if the green one intersects the red one from below, and — for Short position, when the red one crosses the green line from below.
Screenshots
Similar Indicators / Formulas
Febo RSI ..real indicator
Submitted
by abhinavsingh over 12 years ago
Trading Volume Statistic
Submitted
by tuanstock1 almost 10 years ago
Ergodic Oscillator
Submitted
by dljtrader over 13 years ago
3 Days Track
Submitted
by janet0211 almost 14 years ago
Chande Momentum Oscillator
Submitted
by klimpek over 13 years ago
BoH Risk Aversion Indicator
Submitted
by genkumag over 12 years ago
Indicator / Formula
Copy & Paste Friendly
_SECTION_BEGIN("Dynamic Traders Index");
PlotGrid(32, colorLightGrey);
PlotGrid(50, colorLightGrey);
PlotGrid(68, colorLightGrey);
a = DEMA(RSI(13),2);
b = MA(a,7);
bh = DEMA(a,34)+2*(StDev(a,34));
bl = DEMA(a,34)-2*(StDev(a,34));
bm = (bh+bl)/2;

Plot(a, "TDI - Traders Dynamic Index ", colorGreen, styleThick);
Plot(b,"TSL", colorRed);

Plot( bh , "", colorLightBlue);
Plot( bl , "", colorLightBlue);
Plot(bm,"", colorDarkYellow);


_SECTION_END();
0 comments
Leave Comment
Please login here to leave a comment.
Back