Stock Portfolio Organizer
The ultimate porfolio management solution.
Shares, Margin, CFD's, Futures and Forex
EOD and Realtime
Dividends and Trust Distributions
And Much More ....
WiseTrader Toolbox
#1 Selling Amibroker Plugin featuring:
Advanced Adaptive Indicators
Advanced Pattern Exploration
Neural Networks
And Much More ....
Buy & Volatbuy & TGL for Amibroker (AFL)
Rating:
3 / 5 (Votes 3)
Tags:
trading system, amibroker, bands
Sancta Simplicitas!
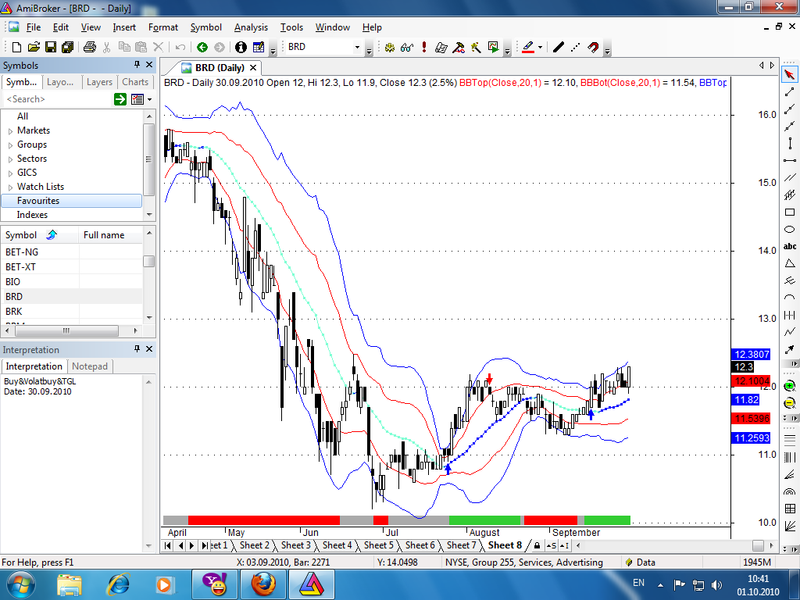
Screenshots
Similar Indicators / Formulas
Heikin Ashi HaDiffCO
Submitted
by kaiji over 14 years ago
Turtle trading system
Submitted
by clerobson over 11 years ago
Scan Buy Sell & BB
Submitted
by morgen about 14 years ago
Fix Kenzie SR System
Submitted
by jachyuen over 12 years ago
Bollinger EMA TRADING SYSTEM WITH EXPLORATION
Submitted
by anandnst over 11 years ago
Bollinger Trading system
Submitted
by anandnst over 11 years ago
Indicator / Formula
Copy & Paste Friendly
//PRICE
_SECTION_BEGIN("Price");
SetChartOptions(0,chartShowArrows|chartShowDates);
_N(Title = StrFormat("{{NAME}} - {{INTERVAL}} {{DATE}} Open %g, Hi %g, Lo %g, Close %g (%.1f%%) {{VALUES}}", O, H, L, C,
           SelectedValue( ROC( C, 1 ) ) ));
Plot( C, "Close", ParamColor("Color", colorBlack ), styleNoTitle | ParamStyle("Style") | GetPriceStyle() );
_SECTION_END();
//==================================================================================================================
//BOLLINGER BANDS
_SECTION_BEGIN("BB1");
P = ParamField("Price field",-1);
Periods = Param("Periods", 20, 1, 300, 1 );
Width = Param("Width", 1, 0, 10, 0.05 );
Color = ParamColor("Color", colorCycle );
Style = ParamStyle("Style");
Plot( BBandTop( P, Periods, Width ), "BBTop" + _PARAM_VALUES(), colorRed, Style );
Plot( BBandBot( P, Periods, Width ), "BBBot" + _PARAM_VALUES(), colorRed, Style );
_SECTION_END();
_SECTION_BEGIN("BB2");
P = ParamField("Price field",-1);
Periods = Param("Periods", 20, 2, 300, 1 );
Width = Param("Width", 2, 0, 10, 0.05 );
Color = ParamColor("Color", colorCycle );
Style = ParamStyle("Style");
Plot( BBandTop( P, Periods, Width ), "BBTop" + _PARAM_VALUES(), Color, Style );
Plot( BBandBot( P, Periods, Width ), "BBBot" + _PARAM_VALUES(), Color, Style );
_SECTION_END();
//==============================================================================================
_SECTION_BEGIN("MA20");
MA20upcol=IIf(MA(C,20)>Ref(MA(C,20),-1),colorBlue,colorAqua) ;
Plot( MA(C,20),"MA20", ma20upcol, styleDots) ;
_SECTION_END();
//xxxxxxxxxxxxxxxxxxxxxxxxxxxxxxxxxxxxxxxxxxxxxxxxxxxxxxxxxxxxxxxxxxxxxxxxxxxxxxxxxxxxxxxxxxxxxxx
//TRENDING RIBBON
// Paste the code below to your price chart somewhere and green ribbon means both
// both MACD and ADX trending up so if the red ribbon shows up the MACD and the ADX
// are both trending down.
_SECTION_BEGIN("trending ribbon");
uptrend=PDI()>MDI() AND MACD()>Signal();
downtrend=MDI()>PDI() AND Signal()>MACD();
Plot( 2, /* defines the height of the ribbon in percent of pane width */"ribbon",
IIf( uptrend, colorLime, IIf( downtrend, colorRed, 0 )), /* choose color */
styleOwnScale|styleArea|styleNoLabel, -0.5, 100 );
_SECTION_END();
//xxxxxxxxxxxxxxxxxxxxxxxxxxxxxxxxxxxxxxxxxxxxxxxxxxxxxxxxxxxxxxxxxxxxxxxxxxxxxxxxxxxxxxxxxxxxxxxxxxxxxxxxx
//FORMULE
P = ParamField("Price field",-1);
cuptop1=C>BBandTop(p,20,1) ;
bot1=BBandBot(p,20,1) ;
top2=BBandTop(p,20,2) ;
bot2=BBandBot(p,20,2) ;
stocup=StochK()>StochD() ;
MACDup=MACD()>Signal() ;
Hist=MACD()-Signal() ;
Histup=Hist>Ref(Hist,-1) ;
MFIupema5=MFI()>EMA(MFI(),5) ;
Cupo=C>O ;
top1up=BBandTop(p,20,1)>Ref(BBandTop(p,20,1),-1) ;
band=BBandTop(p,20,2)-BBandBot(p,20,2) ;
Volatbuy=band>Ref(band,-1) ;
cupbot1=C>BBandBot(p,20,1) ;
bot1up=BBandBot(p,20,1)>Ref(BBandBot(p,20,1),-1) ;
MA20up=MA(C,20)>Ref(MA(C,20),-1) ;
Vup10=V>10000 ;
CCIup0=CCI()>0 ;
//xxxxxxxxxxxxxxxxxxxxxxxxxxxxxxxxxxxxxxxxxxxxxxxxxxxxxxxxxxxxxxxxxxxxxxxxxxxxxxxxxxxxxxxxxxxxxxxxxxxxxxx
//PARAMTOGGLE
// This combines indicators into one timing Signal
//function ParamOptimize( description, default, minv, maxv, step )
//    { return Optimize(description, Param(description,default, minv, maxv, step ), minv, maxv, step ); }
tgl = ParamToggle("Result", "AND logic|Compare");
// switch test calculation and compare the results
if(tgl)
{
myBuy = volatbuy AND MA20up AND Histup AND MFIupema5 AND MACDup AND stochup ;
myShort = !volatbuy AND !Histup AND !mfiupema5 ;
}
else
{
myBuy   = IIf( band>Ref(band,-1) AND MA(C,20)>Ref(MA(C,20),-1) AND Hist>Ref(Hist,-1) AND MFI()>EMA(MFI(),5) AND
          MACD()>Signal() AND StochK()>StochD()       ,1,0);
myShort = IIf( band<Ref(band,-1) AND Hist<Ref(Hist,-1) AND MFI()<EMA(MFI(),5)       ,1,0);
}

Buy = ExRem(myBuy, myShort);
Sell = ExRem(myShort, myBuy);

PlotShapes(IIf(Buy,shapeUpArrow,shapeNone),colorBlue,0,L,Offset=-10);
PlotShapes(IIf(Sell,shapeDownArrow,shapeNone),colorRed,0,H,Offset=-10);
4 comments
Leave Comment
Please login here to leave a comment.
Back
If you like bottomtrading, replace volatbuy with cupbot1 and eventually without ma20up.
system is not diplaying buy & sell arrows pls slove the issue
System works fine, believe me!
Arrows are blue (buy) and red (sell).
Do “copy&paste” again!
Superb AFL.