SUPPORT & RESISTANCE for Amibroker (AFL)
prasadbrao almost 16 years ago Amibroker (AFL)
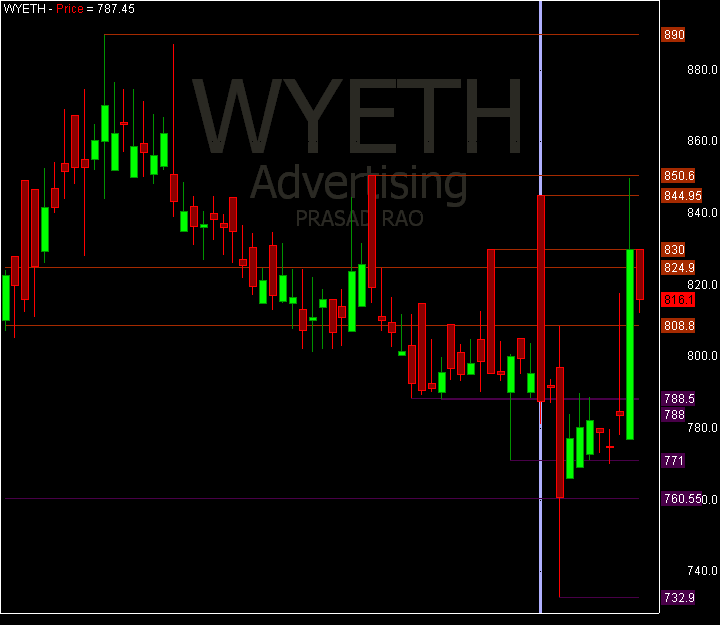
Detects supports and resistances
Screenshots
Indicator / Formula
Copy & Paste Friendly
_SECTION_BEGIN("Name");
GfxSetOverlayMode(1);
GfxSelectFont("Tahoma", Status("pxheight")/8 );
GfxSetTextAlign( 6 );// center alignment
GfxSetTextColor( ColorHSB( 42, 42, 42 ) );
GfxSetBkMode(0); // transparent
GfxTextOut( Name(), Status("pxwidth")/2, Status("pxheight")/12 );
GfxSelectFont("Tahoma", Status("pxheight")/18 );
GfxTextOut( IndustryID(1), Status("pxwidth")/2, Status("pxheight")/4 );

GfxSelectFont("Tahoma", Status("pxheight")/18 );
GfxSelectFont("Tahoma", Status("pxheight")/36 );
GfxTextOut( "PRASAD RAO", Status("pxwidth")/2, Status("pxheight")/3 );
_SECTION_END();

SetBarFillColor( IIf(O>C,colorDarkRed, colorBrightGreen ) );
Plot( C, "Price", IIf( O>C,colorRed, colorGreen ), styleCandle );

HaClose =EMA((O+H+L+C)/4,3);
HaOpen = AMA( Ref( HaClose, -1 ), 0.5 );
HaHigh = Max( H, Max( HaClose, HaOpen ) );
HaLow = Min( L, Min( HaClose, HaOpen ) );

_SECTION_BEGIN("Resistance");

supres=ParamToggle("Sup_Res","No|Yes",1);
if(supres)
{


Prd1=Param("Res_Period1",2,0,200,1);

test   = TEMA  ( High , Prd1 ) ;

PK = test > Ref(test,-1) AND Ref(test,1) < High;//Peak
PKV0 = ValueWhen(PK,haHigh,0);//PeakValue0
PKV1 = ValueWhen(PK,haHigh,1);//PeakValue1
PKV2 = ValueWhen(PK,haHigh,2);//PeakValue2

MPK = PKV2 < PKV1 AND PKV1 > PKV0 ;//MajorPeak

MPKV = ValueWhen(Ref(MPK,-1) == 0 AND MPK == 1, PKV1,1); //MajorPeakValue
MPKD = ValueWhen(Ref(MPK,-1) == 0 AND MPK == 1, DateNum(),1); //MajorPeakDate
SD = IIf(DateNum() < LastValue(MPKD,lastmode = True ), Null, LastValue(MPKV,Lastmode = True));//SelectedDate
Plot(SD, "Resist1",  colorBrown,ParamStyle("ResStyle1",styleLine|styleNoTitle,maskAll));

MPKV2 = ValueWhen(Ref(MPK,-1) == 0 AND MPK == 1, PKV1,2); //MajorPeakValue
MPKD2 = ValueWhen(Ref(MPK,-1) == 0 AND MPK == 1, DateNum(),2); //MajorPeakDate
SD2 = IIf(DateNum() < LastValue(MPKD2,lastmode = True ), Null, LastValue(MPKV2,Lastmode = True));//SelectedDate
Plot(SD2, "Resist2",  colorBrown,ParamStyle("ResStyle2",styleLine|styleNoTitle,maskAll));


MPKV3 = ValueWhen(Ref(MPK,-1) == 0 AND MPK == 1, PKV1,3); //MajorPeakValue
MPKD3 = ValueWhen(Ref(MPK,-1) == 0 AND MPK == 1, DateNum(),3); //MajorPeakDate
SD3 = IIf(DateNum() < LastValue(MPKD3,lastmode = True ), Null, LastValue(MPKV3,Lastmode = True));//SelectedDate
Plot(SD3, "Resist3", colorBrown,ParamStyle("ResStyle3",styleLine|styleNoTitle,maskAll));


MPKV4 = ValueWhen(Ref(MPK,-1) == 0 AND MPK == 1, PKV1,4); //MajorPeakValue
MPKD4 = ValueWhen(Ref(MPK,-1) == 0 AND MPK == 1, DateNum(),4); //MajorPeakDate
SD4 = IIf(DateNum() < LastValue(MPKD4,lastmode = True ), Null, LastValue(MPKV4,Lastmode = True));//SelectedDate
Plot(SD4, "Resist4",  colorBrown,ParamStyle("ResStyle4",styleLine|styleNoTitle,maskAll));


MPKV5 = ValueWhen(Ref(MPK,-1) == 0 AND MPK == 1, PKV1,5); //MajorPeakValue
MPKD5 = ValueWhen(Ref(MPK,-1) == 0 AND MPK == 1, DateNum(),5); //MajorPeakDate
SD5 = IIf(DateNum() < LastValue(MPKD5,lastmode = True ), Null, LastValue(MPKV5,Lastmode = True));//SelectedDate
Plot(SD5, "Resist5",  colorBrown,ParamStyle("ResStyle5",styleLine|styleNoTitle,maskAll));


MPKV6 = ValueWhen(Ref(MPK,-1) == 0 AND MPK == 1, PKV1,6); //MajorPeakValue
MPKD6 = ValueWhen(Ref(MPK,-1) == 0 AND MPK == 1, DateNum(),6); //MajorPeakDate
SD6 = IIf(DateNum() < LastValue(MPKD6,lastmode = True ), Null, LastValue(MPKV6,Lastmode = True));//SelectedDate
Plot(SD6, "Resist6", colorBrown ,ParamStyle("ResStyle6",styleLine|styleNoTitle,maskAll));


_SECTION_END();


_SECTION_BEGIN("Support");
//SP=L > Ref(L,-1) AND Ref(L,1) < L;//Peak

Prd2=Param("Sup_Period1",2,0,200,1);

test2   = TEMA ( Low , Prd2 ) ;

SP = Ref(test2,1) > Low AND test2 < Ref(test2,-1);//Peak
SPV0 = ValueWhen(SP,haLow,0);//PeakValue0
SPV1 = ValueWhen(SP,haLow,1);//PeakValue1
SPV2 = ValueWhen(SP,haLow,2);//PeakValue2

//PKV5 = ValueWhen(PK,haHigh,5);//PeakValue5
//PKV6 = ValueWhen(PK,haHigh,6);//PeakValue6

MSP = SPV2 > SPV1 AND SPV1 < SPV0 ;//MajorPeak

MSPV = ValueWhen(Ref(MSP,-1) == 0 AND MSP == 1, SPV1,1);
MSPD = ValueWhen(Ref(MSP,-1) == 0 AND MSP == 1, DateNum(),1);
SD = IIf(DateNum() < LastValue(MSPD,lastmode = True ), Null, LastValue(MSPV,Lastmode = True));
Plot(SD,"Support1",  colorPlum,ParamStyle("SupportLine1",styleLine|styleNoTitle,maskAll));


MSPV2 = ValueWhen(Ref(MSP,-1) == 0 AND MSP == 1, SPV1,2);
MSPD2 = ValueWhen(Ref(MSP,-1) == 0 AND MSP == 1, DateNum(),2);
SD2 = IIf(DateNum() < LastValue(MSPD2,lastmode = True ), Null, LastValue(MSPV2,Lastmode = True));
Plot(SD2,"Support2",  colorPlum,ParamStyle("SupportLine2",styleLine|styleNoTitle,maskAll));


MSPV3 = ValueWhen(Ref(MSP,-1) == 0 AND MSP == 1, SPV1,3);
MSPD3 = ValueWhen(Ref(MSP,-1) == 0 AND MSP == 1, DateNum(),3);
SD3 = IIf(DateNum() < LastValue(MSPD3,lastmode = True ), Null, LastValue(MSPV3,Lastmode = True));
Plot(SD3,"Support3",  colorPlum,ParamStyle("SupportLine3",styleLine|styleNoTitle,maskAll));


MSPV4 = ValueWhen(Ref(MSP,-1) == 0 AND MSP == 1, SPV1,4);
MSPD4 = ValueWhen(Ref(MSP,-1) == 0 AND MSP == 1, DateNum(),4);
SD4 = IIf(DateNum() < LastValue(MSPD4,lastmode = True ), Null, LastValue(MSPV4,Lastmode = True));
Plot(SD4,"Support4",  colorPlum,ParamStyle("SupportLine4",styleLine|styleNoTitle,maskAll));


MSPV5 = ValueWhen(Ref(MSP,-1) == 0 AND MSP == 1, SPV1,5);
MSPD5 = ValueWhen(Ref(MSP,-1) == 0 AND MSP == 1, DateNum(),5);
SD5 = IIf(DateNum() < LastValue(MSPD5,lastmode = True ), Null, LastValue(MSPV5,Lastmode = True));
Plot(SD5,"Support5",  colorPlum,ParamStyle("SupportLine5",styleLine|styleNoTitle,maskAll));


MSPV6 = ValueWhen(Ref(MSP,-1) == 0 AND MSP == 1, SPV1,6);
MSPD6 = ValueWhen(Ref(MSP,-1) == 0 AND MSP == 1, DateNum(),6);
SD6 = IIf(DateNum() < LastValue(MSPD6,lastmode = True ), Null, LastValue(MSPV6,Lastmode = True));
Plot(SD6,"Support6",  colorPlum,ParamStyle("SupportLine6",styleLine|stylehidden|styleNoTitle,maskAll));

}

_SECTION_END();
8 comments
Leave Comment
Please login here to leave a comment.
IT SHOWN SYNTAX ERROR IN AMIBROKER 5.00
The problem is same as the metacandle afl,
you can fix it by adding " = ",between words setBarFillColor and (Insidecolor);
My regards
Chynthia
dear friend, am face as the same problem,,,pls try to rectify… thx…
I am using Amibroker 5.20 and am working on some more customised indicators on the same.
The support and resistance works well in ami 5.20.
The syntax error may be coz of some change in the programming in 5 and 5.20.
Dear friends,
The Suport and Resistance afl can work well in Ami 5.00,if you
adding =,at Ln:16,Col:1 ,between words SetBarFillColor and ( IIf(O>C,colorDarkRed, colorBrightGreen ) );
These is The Results :
SetBarFillColor=( IIf(O>C,colorDarkRed, colorBrightGreen ) );
My Regards
Chynthia
Wonderful!
Very useful!
Thank You very much!
PK = test > Ref(test,-1) AND Ref(test,1) < High;//Peak
SP = Ref(test2,1) > Low AND test2 < Ref(test2,-1);//Peak
Plz, show me a broker that can take such orders.
In version 5.5 and above, the rules starting from the day start, not from HH or LL.
Can anyone modify this.