Stock Portfolio Organizer
The ultimate porfolio management solution.
WiseTrader Toolbox
#1 Selling Amibroker Plugin featuring:
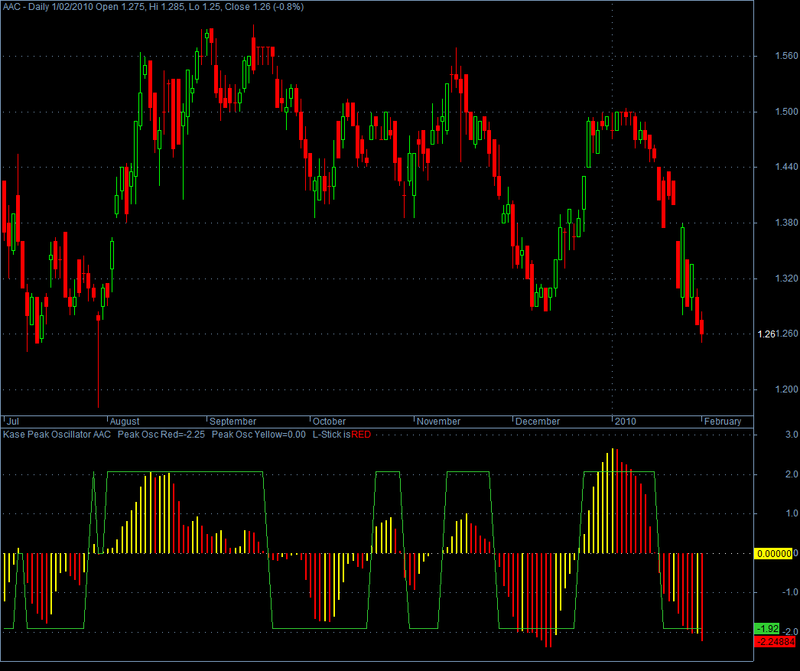
Kase Peak Oscillator Clone for Amibroker (AFL)
The PeakOscillator plot is used similarly to traditional oscillators but is derived from a mathematically sound, statistical evaluation of trend that evaluates over 50 different trend lengths, rather than just two as the traditional oscillator does. It automatically adapts for cycle length and volatility changes.
The PeakOscillator is “universal” in that it scales to volatility, and can be compared over differing commodities and time frames.
Two other features of the PeakOscillator are the PeakMax and PeakMin lines.
The PeakMax line is the maximum of the 2 standard deviations of the local PeakOscillator reading and the 90th percentile of momentum, historically. The PeakMin is the minimum of the two.
Interpretation:
The PeakOscillator is used two ways.
Divergence — The PeakOscillator may be used to generate traditional divergence signals. The difference between it and traditional divergence indicators lies in its accuracy.
PeakOut — The second use is to look for a PeakOut. A PeakOut occurs when the histogram breaks beyond the PeakOut line and then pulls back.
A PeakOut through the maximum line will be labeled PG (Global PeakOut) on the chart. A PeakOut that only extends through the PeakMin line is called a local PeakOut and will be labeled PL on the chart. A local PeakOut is less significant than a normal PeakOut signal. These local PeakOuts are to be relied upon more heavily during sideways or corrective markets.
PeakOuts may be based on either the Maximum Line or the Minimum Line. Global PeakOuts, however, are rarer and therefore more significant than a Local PeakOut. The magnitude of the price move may be greater following the Global PeakOut, but the likelihood of the break in trend is essentially the same. Thus, our research indicates that we should react equally to a Global PeakOut in a trendy market and a Local PeakOut in a choppy or corrective market.
Screenshots
Similar Indicators / Formulas
7 comments
Leave Comment
Please login here to leave a comment.
Back
Can you explain the colours bars and the process to follow it?
The yellow bars signifying an increasing divergence which is a bullish sign. The red bars on the other hand signifying a decreasing divergence which is a bearish sign. The Green line is your buy and sell line when it is below zero you buy and when it is above zero you sell.
I hope this clarifies the indicator.
thanks for wonderful afl.
nice indicators, thanks.
Suitable for my style trading (like as the best timing “entry and exit”), thanks for this powerful AFL.
POST NEW FORMULAR
Comment hidden - Show