Stock Portfolio Organizer
The ultimate porfolio management solution.
Shares, Margin, CFD's, Futures and Forex
EOD and Realtime
Dividends and Trust Distributions
And Much More ....
WiseTrader Toolbox
#1 Selling Amibroker Plugin featuring:
Advanced Adaptive Indicators
Advanced Pattern Exploration
Neural Networks
And Much More ....
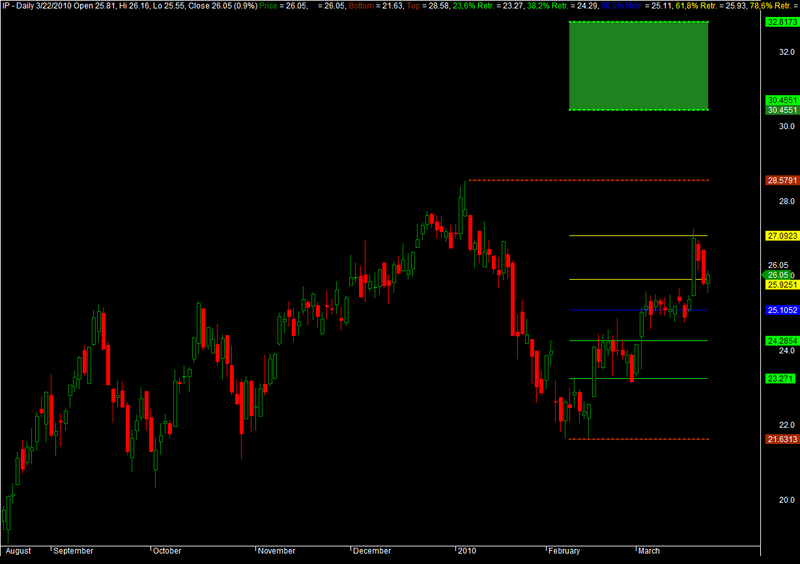
Fibonacci Retracements for Amibroker (AFL)
Rating:
4 / 5 (Votes 12)
Tags:
amibroker, exploration, fibonacci
موشر فيبوناتشي رسم الي مع تحديد الهدف المتوقع
جيج جداااااا
Fibonacci retracements indicator.
Screenshots
Similar Indicators / Formulas
Fibonacci Ratracements by Gordon Rose
Submitted
by kaiji over 16 years ago
NIRMALA 5I WITH BLINK COLOUR
Submitted
by iwan over 15 years ago
Price Exp Indicator
Submitted
by janet0211 almost 16 years ago
Auto Fib-R
Submitted
by twisterbee over 15 years ago
2 periods explorer
Submitted
by ishlakh over 14 years ago
Bullish-Bearish 23.6 Percent Retracement Reversal_Daily
Submitted
by indraji2001 almost 12 years ago
Indicator / Formula
Copy & Paste Friendly
_SECTION_BEGIN("MOB simulation shiree");

SetChartOptions(0,chartShowArrows|chartShowDates);


_N(Title = StrFormat("{{NAME}} - {{INTERVAL}} {{DATE}} Open %g, Hi %g, Lo %g, Close %g (%.1f%%) {{VALUES}}", O, H, L, C, SelectedValue( ROC( C, 1 ) ) ));
//Plot( C, "Close", ParamColor("Color", colorPink ), styleNoTitle | ParamStyle("Style") | GetPriceStyle() );
PlotOHLC(O,H,L,C,"Price",IIf(C>O,colorGreen,colorRed),styleCandle);


//Date: 12-January 2002 by Thomas Zmuck
//thomas.zm@ aon.at
Offset = 5; //use two sheets: one with 5 and another with 7, or maybe other offset value
Avgmov = Offset*MA(abs( ROC(C,1)) ,20);
per = LastValue(Avgmov) ;
x=Cum(1);
Range = 0.01;
PS = TroughBars(L, per,1) == 0;
xa = LastValue(ValueWhen (PS,x,1)) ;//x from last trough
Ya = LastValue(ValueWhen (PS,L,1)) ;//y (Low) last trough
PR = PeakBars(H,per, 1) == 0;
xb = LastValue(ValueWhen (PR,x,1)) ;//x from last peak
Yb = LastValue(ValueWhen (PR,H,1)) ;//y (High) last peak
Trough_ReTest = abs((L/ya)-1) <Range;
Peak_ReTest = abs((H/yb)-1) <Range;
Trough_Cross = Cross(ya,C);
Peak_Cross = Cross(C,yb);
//UP = upSwing DN = downSwing
UP = xb>xa;//upSwing
DN = xa>xb;//DownSwing
RT23_6 = IIf(UP,yb-(yb- ya)*0.236, IIf(DN,ya+ (yb-ya)*0.236,-1e10) );
RT38_2 = IIf(UP,yb-(yb- ya)*0.382, IIf(DN,ya+ (yb-ya)*0.382,-1e10) );
RT50_0 = IIf(UP,yb-(yb- ya)*0.500, IIf(DN,ya+ (yb-ya)*0.500,-1e10) );
RT61_8 = IIf(UP,yb-(yb- ya)*0.618, IIf(DN,ya+ (yb-ya)*0.618,-1e10) );
RT78_6 = IIf(UP,yb-(yb- ya)*0.786, IIf(DN,ya+ (yb-ya)*0.786,-1e10) );

RT12_7 = IIf(UP,yb-(yb- ya)*1.27, IIf(DN,ya+ (yb-ya)*1.27,-1e10) );
RT16_1 = IIf(UP,yb-(yb- ya)*1.61, IIf(DN,ya+ (yb-ya)*1.61,-1e10) );

RT=
IIf(UP,-100* (yb-L)/(yb- ya),
100*(H-ya)/( yb-ya));//Retracement_ Value
InZone = C<yb & C>ya;//use it for filter to receive only signals that are in in the Retracement zone.
Buy = Trough_ReTest OR peak_Cross;
Sell = Peak_ReTest OR trough_Cross;
Filter = 1;
AddColumn(RT, "RT%");
AddColumn(Trough_ReTest,"TR- Test",1.0) ;
AddColumn(Peak_ReTest,"PK-Test",1.0) ;
AddColumn(Trough_Cross,"TR-Cross",1.0);
AddColumn(Peak_Cross,"PK-Cross",1.0);
//AddColumn(CdDoji( )OR CHammer(),"Candle" ,1.0);
Plot(C,"C",1, 64);
Plot(IIf(x>xa, ya,-1e10) ,"Bottom" ,colorBrown, 1+8);
Plot(IIf(x>xb, yb,-1e10) ,"Top",colorBrown,1+8);
xab = IIf(xb>xa,xb, xa);
//Retracements
Plot(IIf(x>= xab+1,RT23_6,-1e10), "23,6% Retr.",5,1);
Plot(IIf(x>= xab+1,RT38_2,-1e10), "38,2% Retr.",5,1);
Plot(IIf(x>= xab+1,RT50_0,-1e10), "50,0% Retr.",colorBlue, 1);
Plot(IIf(x>= xab+1,RT61_8,-1e10), "61,8% Retr.",colorYellow, 1);
Plot(IIf(x>= xab+1,RT78_6,-1e10), "78,6% Retr.",colorYellow, 1);

Plot(IIf(x>= xab+1,RT12_7,-1e10), "127% ext.",colorBrightGreen, styleDots);
Plot(IIf(x>= xab+1,RT16_1,-1e10), "161% ext.",colorBrightGreen, styleDots);
CondA=IIf(x>= xab+1,RT12_7,-1e10);
CondB=IIf(x>= xab+1,RT16_1,-1e10);
PlotOHLC(Condb,Condb,Conda,Conda,"",ColorRGB(30,130,30),styleCloud,styleNoLabel);


GraphXSpace = 0.5;


//Plot(Gauss2ord(C,5),"M5",4,1);
//GraphXSpace = 1.5;
//Title = Name()+" per = "+WriteVal(per, 1.0) +" Close = "+WriteVal(C, 1.2)+ " ("+WriteVal( ROC(C,1), 1.2)+"%)" +" Current Correction = "+WriteVal(RT, 1.0)+"%";

//Plot( Volume,"V", ParamColor("Color", colorBlueGrey ), ParamStyle( "Style", stylehidden| styleOwnScale | styleThick, maskHistogram  ), 2 );


_SECTION_END( );
5 comments
Leave Comment
Please login here to leave a comment.
Back
Excellent!!!
nice work
Somebody posted my AFL modification here.
Shiree
Hi all,
Kindly let me know when to buy? When to sell? can someone include buy/sell marks…
Yes Shiree who is known to create unconventional AFLs which greatly helps every body trade successfuly is being copied. This is just the MOB (AGet) which Shiree created. Shame on you bro. I know this is a very late comment, but this cant be tolerated.