Stock Portfolio Organizer
The ultimate porfolio management solution.
Shares, Margin, CFD's, Futures and Forex
EOD and Realtime
Dividends and Trust Distributions
And Much More ....
WiseTrader Toolbox
#1 Selling Amibroker Plugin featuring:
Advanced Adaptive Indicators
Advanced Pattern Exploration
Neural Networks
And Much More ....
MPLite--KAKA & Heinkin Ashi & NickMA for Amibroker (AFL)
Rating:
3 / 5 (Votes 10)
Tags:
trading system, amibroker, pivots
Heinkin Ashi Price Action with pivots points, market profile and support and resistance levels.
Screenshots
Similar Indicators / Formulas
Trend and Pivot with Support And Resistance Levels
Submitted
by varadan over 11 years ago
T3 function cloud
Submitted
by ahmmad almost 13 years ago
Isfandi Trading System II
Submitted
by isfandi about 13 years ago
Nataraj modified
Submitted
by pully50 over 12 years ago
BOLLINGER BAND AND CROSS OVER SYSTEM
Submitted
by prasadmuni over 11 years ago
Indicator / Formula
Copy & Paste Friendly
//R2=> Heinkin Ashi Price Action
//R1=> Decorative Works
_SECTION_BEGIN("Chart Settings");
SetChartOptions(0,chartShowArrows|chartShowDates);
SetChartBkColor(ParamColor("Outer Panel",colorPaleBlue));
SetChartBkGradientFill(ParamColor("Upper Chart",1),ParamColor("Lower Chart",23));
GraphXSpace=Param("GraphXSpace",10,0,100,1);
dec = (Param("Decimals",2,0,7,1)/10)+1;
bi = BarIndex();
Lbi = LastValue(BarIndex());
sbi = SelectedValue(bi);
x1= BarCount-1;
Title = EncodeColor(55)+ Title = Name() + " " + EncodeColor(32) + Date() +
" " + EncodeColor(5) + "{{INTERVAL}} " +
EncodeColor(55)+ " Open = "+ EncodeColor(52)+ WriteVal(O,dec) +
EncodeColor(55)+ " High = "+ EncodeColor(5) + WriteVal(H,dec) +
EncodeColor(55)+ " Low = "+ EncodeColor(32)+ WriteVal(L,dec) +
EncodeColor(55)+ " Close = "+ EncodeColor(52)+ WriteVal(C,dec)+
EncodeColor(55)+ " Volume = "+ EncodeColor(52)+ WriteVal(V,1);
_SECTION_END();
_SECTION_BEGIN("MPLite Kaka");
//PlotOHLC(O,H,L,C,"Price",IIf(C>O,colorGreen,colorRed),styleCandle);
function Lastthursday()
{
Daysinmonth=IIf(Month()==1 OR Month()==3 OR Month()==5 OR Month()==7 OR Month()==8 OR Month()==10 OR Month()==12,31,30);
Daysinmonthfeb=IIf(Year()%4 == 0 AND Year()%100!=0,29,28);
Daysinmonthfinal=IIf(Month()==2,Daysinmonthfeb,Daysinmonth);
returnvalue=IIf(Daysinmonthfinal-Day()<7 AND DayOfWeek()==4,1,IIf(Daysinmonthfinal-Day()<8 AND DayOfWeek()==3 AND Ref(DayOfWeek(),1)!=4,1,0));
return returnvalue;
}
FirstVisibleBar = Status( "FirstVisibleBar" );
Lastvisiblebar = Status( "LastVisibleBar" );
totalVisible=Lastvisiblebar-FirstVisibleBar;
//if(totalVisible<1500){
//Den = Param("Density", 1, 0.1, 10, 0.1);
percent=Param("Value Area", 70, 1, 100, 1);
Type=ParamList("Type","Price Profile|Volume Profile");
Period= ParamList("Base","Hourly|Daily|Weekly|Monthly|Lastthursday|Yearly",1);
x_scale=Param("Horizontal_scale", 2, 0, 10, 0.1);
EnMP2= ParamStyle("Style",styleLine|styleNoLabel,maskAll);
styleLines=styleDots;
ViewYvalues= ParamToggle("Show Yesterdays Values", "No|Yes",1);
ViewVlines= ParamToggle("Show Vertical Base Lines", "No|Yes",1);
Viewvalues= ParamToggle("Show Values", "No|Yes",0);
ViewVpoc= ParamToggle("Show Virgin POC", "No|Yes",1);
ViewTPO=ParamToggle("Show TPO Count", "No|Yes",0);
if(Period=="Hourly"){
BarsInDay = BarsSince(Hour() != Ref(Hour(), -1));Bot = TimeFrameGetPrice("L", inHourly, 0);Top = TimeFrameGetPrice("H", inHourly, 0);Vol = TimeFrameGetPrice("V", inHourly, 0);
}
if(Period=="Daily" ){//OR Interval()==3600
BarsInDay = BarsSince(Day() != Ref(Day(), -1));Bot = TimeFrameGetPrice("L", inDaily, 0);Top = TimeFrameGetPrice("H", inDaily, 0);Vol = TimeFrameGetPrice("V", inDaily, 0);
}
if(Period=="Weekly" OR Interval()==24 * 3600 ){
BarsInDay = BarsSince(DayOfWeek() < Ref( DayOfWeek(), -1 ));Bot = ValueWhen(Ref(BarsInDay,1)==1 OR BarIndex()>BarCount-2 ,LLV(L,BarsInDay),0);Top =ValueWhen(Ref(BarsInDay,1)==1 OR BarIndex()>BarCount-2,HHV(H,BarsInDay),0);Vol = TimeFrameGetPrice("V", inWeekly, 0);
}
if(Period=="Monthly" ){
BarsInDay = BarsSince(Month() != Ref(Month(), -1));Bot = TimeFrameGetPrice("L", inMonthly, 0);Top = TimeFrameGetPrice("H", inMonthly, 0);Vol = TimeFrameGetPrice("V", inMonthly, 0);
}
if(Period=="Lastthursday" ){
BarsInDay = BarsSince(Lastthursday()==1 AND Ref(Lastthursday(), -1)==0);Bot = ValueWhen(Ref(BarsInDay,1)==1 OR BarIndex()>BarCount-2 ,LLV(L,BarsInDay),0);Top =ValueWhen(Ref(BarsInDay,1)==1 OR BarIndex()>BarCount-2,HHV(H,BarsInDay),0);Vol = TimeFrameGetPrice("V", inMonthly, 0);
}
if(Period=="Yearly" ){
BarsInDay = BarsSince(Year() != Ref(Year(), -1));Bot = TimeFrameGetPrice("L", inYearly, 0);Top = TimeFrameGetPrice("H", inYearly, 0);Vol = TimeFrameGetPrice("V", inYearly, 0);
}
Range = Top-Bot;
coverage=LastValue(ATR(10));
den=(coverage/10);
//multiplier=IIf(round(totalVisible)>500,IIf(round(totalVisible)>1000,3,2),1);
HaClose = (O + H + L + C)/4;
HaOpen = AMA( Ref( HaClose, -1 ), 0.5 );
HaHigh = Max( H, Max( HaClose, HaOpen ) );
HaLow = Min( L, Min( HaClose, HaOpen ) );
xDiff = (HaHigh - Halow) * 10000;
barcolor = IIf(HaClose >= HaOpen,colorGreen,colorRed);
PlotOHLC( HaOpen, HaHigh, HaLow, HaClose, "", barcolor, styleCandle );
multiplier=IIf(round(totalVisible)/300<1,1,round(totalVisible)/300);
if(ViewVlines==1)
{
Plot(BarsInDay==0, "", ParamColor("Base Line Color",colorDarkGrey), styleHistogram | styleOwnScale | styleLine | styleNoLabel);
}
relTodayRange = 0;
x=0;
basey=0;
basex=0;
newday=0;
total=0;
shiftup=0;
shiftdn=0;
Line=Null;
Voloumeunit=0;
for ( i = FirstVisibleBar; i <Lastvisiblebar AND i<BarCount-1 ; i++ )
{
if(BarsInDay[i]==0)
{t=BarsInDay[i-1];
//////////////////////////////////
poc=0;pocj=0;
midrange = int(relTodayRange/2)+1;
for (j=1; j<= relTodayRange+1 ; j++)
{
if(poc < x[j])
{
poc=x[j]; pocj=j;}
else if(poc == x[j])
{
if (abs(midrange-j)< abs(midrange-pocj)){
poc = x[j]; pocj = j;
}
}
}
for ( n = 1; n <= relTodayRange; n++ )
{
total[n]=x[n]+total[n-1];
}
Value_area=(total[relTodayRange]*percent)/100;
for ( a = 1; a <= relTodayRange; a++ )
{
if(pocj-a>0 AND pocj+a<relTodayRange)
{
if(poc+total[pocj+a]-total[pocj]+(total[pocj]-poc)-total[pocj-(a+1)]>=Value_area) {shiftup=a; shiftdn=a; break;}
}
else if(pocj-a<1 )
{
if(poc+total[pocj+a]-total[pocj]+(total[pocj]-poc)>=Value_area){shiftup=a; shiftdn=pocj; break;}
}
else if(pocj+a>relTodayRange )
{
if(poc+total[relTodayRange]-total[pocj]+(total[pocj]-poc)-total[pocj-(a+1)] >=Value_area){shiftup=floor(relTodayRange)-pocj; shiftdn=a+1; break;}
}
}
if(ViewVpoc==1)
{
Virginpoc=basey+pocj*den;
newi=0;
for( j = i+1; j <= (BarCount - 1) ; j++ )
if( L[j] < Virginpoc AND H[j]>Virginpoc )
{newi=j;break;}
else{newi=BarCount;}
vishycolor=IIf(BarCount%2==0,colorRed,colorBlue);
Plot(LineArray(basex[i],basey+pocj*den,newi,basey+pocj*den),"",vishycolor,styleLine|styleNoRescale);
//Plot(LineArray(basex[i],basey+pocj*den,newi,basey+pocj*den),"",colorYellow,styleLine|styleNoRescale);
}
Vah = LineArray(baseX[i], baseY+(pocj+shiftup)*den, i, baseY+(pocj+shiftup)*den);
Val = LineArray(baseX[i], baseY+(pocj-shiftdn)*den, i, baseY+(pocj-shiftdn)*den);
pocline=LineArray(basex,basey+pocj*den,basex[i]+poc,basey+pocj*den);
//Plot(Vah,"",ParamColor("Color_VAH_Line", colorBlueGrey),styleLine|styleNoRescale);
//Plot(Val,"",ParamColor("Color_VAL_Line", colorBlueGrey),styleLine|styleNoRescale);
Vahn = LineArray(i, baseY+(pocj+shiftup)*den, i+t, baseY+(pocj+shiftup)*den);
pocn = LineArray(i, baseY+(pocj)*den, i+t, baseY+(pocj)*den);
Valn = LineArray(i, baseY+(pocj-shiftdn)*den, i+t, baseY+(pocj-shiftdn)*den);
Plot(pocline,"",ParamColor("Color_POC_Line",colorDarkBlue),styleLine|styleNoRescale|styleNoLabel);
if(ViewYvalues==1)
{
Plot(Vahn,"",ParamColor("YVAH",colorBrightGreen),styleDashed|styleNoRescale);
Plot(Valn,"",ParamColor("YVAL",colorYellow),styleDashed|styleNoRescale);
Plot(pocn,"",ParamColor("YPOC",colorDarkRed),styleDashed|styleNoRescale);
}
//PlotOHLC(Vahn,Vahn,Valn,Valn,"",colorPink,styleCloud|styleOwnScale);
if(ViewTPO==1)
{
nnn=HHV(H,BarsInDay);
PlotText(""+(total[relTodayRange]-total[pocj]),basex[i],nnn[i],colorLightGrey);
PlotText(""+(total[pocj-1]),basex[i],basey-den,colorLightGrey);
}
if(Viewvalues==1)
{
PlotText(""+((basey+pocj*den)),baseX[i],basey+pocj*den,colorWhite,colorDarkGrey);
PlotText(""+((baseY+(pocj+shiftup)*den)),baseX[i],baseY+(pocj+shiftup)*den,colorWhite,colorDarkGrey);
PlotText(""+((baseY+(pocj-shiftdn)*den)),baseX[i],baseY+(pocj-shiftdn)*den,colorWhite,colorDarkGrey);
}
for (p = 0; p <= relTodayRange+1; p=p+multiplier)
{
if(P>0){
line = LineArray(baseX, baseY+(p)*Den, baseX+x[p], baseY+(p)*Den);
}
Plot(line,"",IIf(p>(pocj+shiftup),ParamColor("Color_Above_VA", colorDarkRed),IIf(p<=(pocj+shiftup)AND p>=(pocj-shiftdn),ParamColor("Color_VA", colorDarkBlue),ParamColor("Color_Below_VA", colorDarkRed))) , EnMP2);
}
Plot(pocline,"",ParamColor("Color_POC_Line",colorDarkRed),styleLine|styleNoRescale);
///////////////////
basex=0;
x=0;
Basex=i;
baseY=Bot[i];
relTodayRange=Range[i]/Den;
Voloumeunit=Vol[i]/LastValue(BarsInDay);
}
for (j=0; j<= relTodayRange ; j++)
{
if (L[i] <= Bot[i]+j*Den AND H[i] >= Bot[i]+j*Den )
{
if(Type=="Price Profile"){x[j]=(x[j])+x_scale;}
else if(Type=="Volume Profile"){x[j]=x[j]+round(V[i]/Voloumeunit)+1;}
}
}
}
//////////////////////////////////
poc=0;pocj=0;
midrange = int(relTodayRange/2)+1;
for (j=1; j<= relTodayRange+1 ; j++)
{
if(poc < x[j])
{
poc=x[j]; pocj=j;}
else if(poc == x[j])
{
if (abs(midrange-j)< abs(midrange-pocj)){
poc = x[j]; pocj = j;
}
}
}
for ( n = 1; n <= relTodayRange; n++ )
{
total[n]=x[n]+total[n-1];
}
Value_area=(total[relTodayRange]*percent)/100;
for ( a = 1; a <= relTodayRange; a++ )
{
if(pocj-a>0 AND pocj+a<relTodayRange)
{
if(poc+total[pocj+a]-total[pocj]+(total[pocj]-poc)-total[pocj-(a+1)]>=Value_area) {shiftup=a; shiftdn=a; break;}
}
else if(pocj-a<1 )
{
if(poc+total[pocj+a]-total[pocj]+(total[pocj]-poc)>=Value_area){shiftup=a; shiftdn=pocj; break;}
}
else if(pocj+a>relTodayRange )
{
if(poc+total[relTodayRange]-total[pocj]+(total[pocj]-poc)-total[pocj-(a+1)] >=Value_area){shiftup=floor(relTodayRange)-pocj; shiftdn=a+1; break;}
}
}
Vah = LineArray(baseX[i], baseY+(pocj+shiftup)*den, i, baseY+(pocj+shiftup)*den);
Val = LineArray(baseX[i], baseY+(pocj-shiftdn)*den, i, baseY+(pocj-shiftdn)*den);
pocline=LineArray(basex,basey+pocj*den,basex[i]+poc,basey+pocj*den);
if(ViewTPO==1)
{
PlotText(""+(total[relTodayRange]-total[pocj]),basex[i],top[i],colorLightGrey);
PlotText(""+(total[pocj-1]+x_scale),basex[i],basey-den,colorLightGrey);
}
if(Viewvalues==1)
{
PlotText(""+((basey+pocj*den)),baseX[i],basey+pocj*den,colorWhite,colorDarkGrey);
PlotText(""+((baseY+(pocj+shiftup)*den)),baseX[i],baseY+(pocj+shiftup)*den,colorWhite,colorDarkGrey);
PlotText(""+((baseY+(pocj-shiftdn)*den)),baseX[i],baseY+(pocj-shiftdn)*den,colorWhite,colorDarkGrey);
}
for (p = 0; p <= relTodayRange+1; p=p+multiplier)
{
line = LineArray(baseX, baseY+p*Den, baseX+x[p], baseY+p*Den);
Plot(line,"",IIf(p>(pocj+shiftup),ParamColor("Color_Above_VA", colorGrey40),IIf(p<=(pocj+shiftup)AND p>=(pocj-shiftdn),ParamColor("Color_VA", colorBlueGrey),ParamColor("Color_Below_VA",colorGrey40))),EnMP2);
Plot(pocline,"",ParamColor("Color_POC_Line",colorYellow),styleLine|styleNoRescale|styleNoLabel);
}
_SECTION_END();
_SECTION_BEGIN("Volume");
Plot( Volume, _DEFAULT_NAME(), ParamColor("Color", colorDarkGreen), styleNoTitle | ParamStyle( "Style", styleHistogram | styleOwnScale | styleThick | styleNoLabel, maskHistogram ), 2 );
_SECTION_END();
//SetChartOptions(0,chartShowArrows | chartShowDates);
_SECTION_BEGIN("Heikin Ashi");
_SECTION_END();
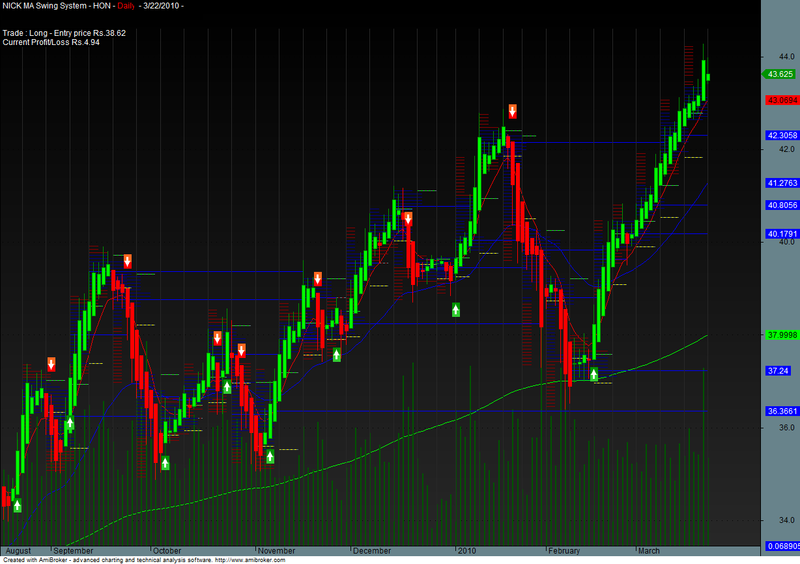
_SECTION_BEGIN("NICK MA Swing");
SetBarsRequired(200,0);
GraphXSpace = 5;
SetChartOptions(0,chartShowArrows|chartShowDates);
k = Optimize("K",Param("K",1,0.25,5,0.25),0.25,5,0.25);
Per= Optimize("atr",Param("atr",4,3,20,1),3,20,1);
HACLOSE=(O+H+L+C)/4;
HaOpen = AMA( Ref( HaClose, -1 ), 0.5 );
HaHigh = Max( H, Max( HaClose, HaOpen ) );
HaLow = Min( L, Min( HaClose, HaOpen ) );
PlotOHLC( HaOpen, HaHigh, HaLow, HaClose, "" + Name(), colorBlack, styleCandle | styleNoLabel );
j=Haclose;
//=======================================================================================================================
//=========================Indicator==============================================================================================
f=ATR(14);
rfsctor = WMA(H-L, Per);
revers = k * rfsctor;
Trend = 1;
NW[0] = 0;
for(i = 1; i < BarCount; i++)
{
if(Trend[i-1] == 1)
{
if(j[i] < NW[i-1])
{
Trend[i] = -1;
NW[i] = j[i] + Revers[i];
}
else
{
Trend[i] = 1;
if((j[i] - Revers[i]) > NW[i-1])
{
NW[i] = j[i] - Revers[i];
}
else
{
NW[i] = NW[i-1];
}
}
}
if(Trend[i-1] == -1)
{
if(j[i] > NW[i-1])
{
Trend[i] = 1;
NW[i] = j[i] - Revers[i];
}
else
{
Trend[i] = -1;
if((j[i] + Revers[i]) < NW[i-1])
{
NW[i] = j[i] + Revers[i];
}
else
{
NW[i] = NW[i-1];
}
}
}
}
//===============system================
Buy=Cover=Cross(j,nw);
Sell=Short=Cross(nw,j);
SellPrice=ValueWhen(Sell,C,1);
BuyPrice=ValueWhen(Buy,C,1);
Long=Flip(Buy,Sell);
Shrt=Flip(Sell,Buy );
_SECTION_END();
//=================TITLE================================================================================================
_SECTION_BEGIN("Title");
if( Status("action") == actionIndicator )
(
Title = EncodeColor(colorWhite)+ "NICK MA Swing System" + " - " + Name() + " - " + EncodeColor(colorRed)+ Interval(2) + EncodeColor(colorWhite) +
" - " + Date() +" - "+"\n" +EncodeColor(colorBlack) +"Op-"+O+" "+"Hi-"+H+" "+"Lo-"+L+" "+
"Cl-"+C+" "+ "Vol= "+ WriteVal(V)+"\n"+
EncodeColor(colorRed)+
WriteIf (Buy , " GO LONG / Reverse Signal at "+C+" ","")+
WriteIf (Sell , " EXIT LONG / Reverse Signal at "+C+" ","")+"\n"+EncodeColor(colorWhite)+
WriteIf(Sell , "Total Profit/Loss for the Last Trade Rs."+(C-BuyPrice)+"","")+
WriteIf(Buy , "Total Profit/Loss for the Last trade Rs."+(SellPrice-C)+"","")+
WriteIf(Long AND NOT Buy, "Trade : Long - Entry price Rs."+(BuyPrice),"")+
WriteIf(shrt AND NOT Sell, "Trade : Short - Entry price Rs."+(SellPrice),"")+"\n"+
WriteIf(Long AND NOT Buy, "Current Profit/Loss Rs."+(C-BuyPrice)+"","")+
WriteIf(shrt AND NOT Sell, "Current Profit/Loss Rs."+(SellPrice-C)+"",""));
PlotShapes(IIf(Buy, shapeSquare, shapeNone),colorGreen, 0, L, Offset=-40);
PlotShapes(IIf(Buy, shapeSquare, shapeNone),colorLime, 0,L, Offset=-50);
PlotShapes(IIf(Buy, shapeUpArrow, shapeNone),colorWhite, 0,L, Offset=-45);
PlotShapes(IIf(Sell, shapeSquare, shapeNone),colorRed, 0, H, Offset=40);
PlotShapes(IIf(Sell, shapeSquare, shapeNone),colorOrange, 0,H, Offset=50);
PlotShapes(IIf(Sell, shapeDownArrow, shapeNone),colorWhite, 0,H, Offset=-45);
AlertIf( Buy, "SOUND C:\\Windows\\Media\\Ringin.wav", "Audio alert", 2 );
AlertIf( Sell, "SOUND C:\\Windows\\Media\\Ringin.wav", "Audio alert", 2 );
_SECTION_END();
_SECTION_BEGIN("MA");
P = ParamField("Price field",-1);
Periods = Param("Periods", 8, 2, 200, 1 );
Plot( EMA( P, Periods ), _DEFAULT_NAME(), ParamColor( "Color", colorCycle ), ParamStyle("Style") | styleNoRescale );
_SECTION_END();
_SECTION_BEGIN("Mid MA");
P = ParamField("Price field",-1);
Periods = Param("Periods", 34, 2, 300, 1 );
Plot( EMA( P, Periods ), _DEFAULT_NAME(), ParamColor( "Color", colorCycle ), ParamStyle("Style") | styleNoRescale );
_SECTION_END();
_SECTION_BEGIN("Long MA");
P = ParamField("Price field",-1);
Periods = Param("Periods", 200, 2, 400, 1 );
Plot( EMA( P, Periods ), _DEFAULT_NAME(), ParamColor( "Color", colorCycle ), ParamStyle("Style") | styleNoRescale );
_SECTION_END();7 comments
Leave Comment
Please login here to leave a comment.
Back
good indicator sir keep it try some think better
good job.. very nice
Excellent…..
Its superb on hourly chart for positional trading.
what is the best TF for intraday
My thanks from the bottom of the heart to kaka
for sharing & helping otherr
Viswanath
Many thanks.
You do a good jobs !!!
Dear Admin,
This AFL Gives Error as given in the picture in the link below
http://imgur.com/6PLRt2D
Please Advise
Thanx
Heikin Ashi Candle section is removed from Code