Stock Portfolio Organizer
The ultimate porfolio management solution.
Shares, Margin, CFD's, Futures and Forex
EOD and Realtime
Dividends and Trust Distributions
And Much More ....
WiseTrader Toolbox
#1 Selling Amibroker Plugin featuring:
Advanced Adaptive Indicators
Advanced Pattern Exploration
Neural Networks
And Much More ....
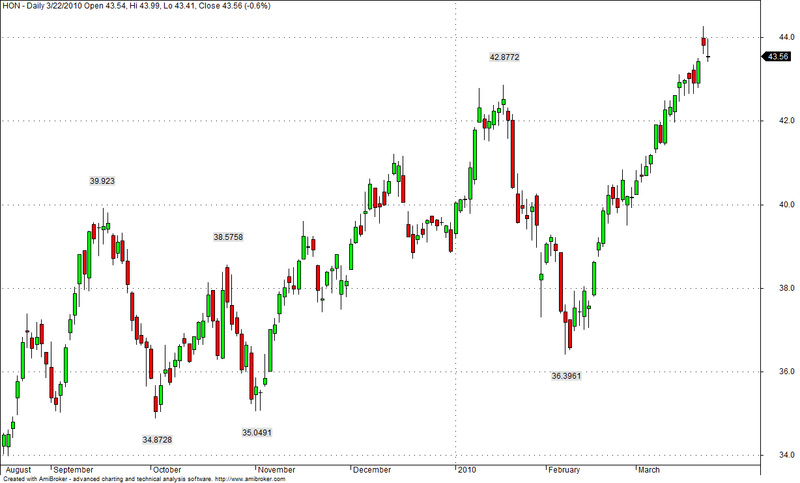
Values of high low for Amibroker (AFL)
Rating:
3 / 5 (Votes 4)
Tags:
amibroker
By using it u can find out high low values form chart.
Screenshots
Similar Indicators / Formulas
Kavach Of Karna v2
Submitted
by hbkwarez almost 10 years ago
Advanced Elliott Waves
Submitted
by MarcosEn over 12 years ago
3_6Day GuaiLiLv
Submitted
by motorfly over 12 years ago
Williams Alligator System
Submitted
by durgesh1712 over 12 years ago
Interactive Linear Regression Channel
Submitted
by InternetWorm over 12 years ago
*Level Breakout system*
Submitted
by Tinych over 12 years ago
Indicator / Formula
Copy & Paste Friendly
_SECTION_BEGIN("Show Values at H&L");

n=Param("Values back",20,1,200,1);
p=Param("zig %",5,1,100,1);
dist = 0.8*ATR(15);

for( i = 1; i < n; i++ )
{
	PlotText(""+LastValue(Peak(H,p,i),True),BarCount-3-LastValue(PeakBars(H,p,i)),LastValue(dist,True)+LastValue(Peak(H,p,i),False),colorBlack,ColorRGB(225,225,225));
	PlotText(""+LastValue(Trough(L,p,i),True),BarCount-3-LastValue(TroughBars(L,p,i)),LastValue(Trough(L,p,i),False)-LastValue(dist,True),colorBlack,ColorRGB(225,225,225));
}

_SECTION_END();

_SECTION_BEGIN("Price");
SetChartOptions(0,chartShowArrows|chartShowDates);
_N(Title = StrFormat("{{NAME}} - {{INTERVAL}} {{DATE}} Open %g, Hi %g, Lo %g, Close %g (%.1f%%) {{VALUES}}", O, H, L, C, SelectedValue( ROC( C, 1 ) ) ));
Plot( C, "Close", ParamColor("Color", colorBlack ), styleNoTitle | ParamStyle("Style") | GetPriceStyle() );
_SECTION_END();
2 comments
Leave Comment
Please login here to leave a comment.
Back
thanks
How can we use this chart for trading.Can you kindly explain?
Will the values get displayed in REAL TIME?