Stock Portfolio Organizer
The ultimate porfolio management solution.
Shares, Margin, CFD's, Futures and Forex
EOD and Realtime
Dividends and Trust Distributions
And Much More ....
WiseTrader Toolbox
#1 Selling Amibroker Plugin featuring:
Advanced Adaptive Indicators
Advanced Pattern Exploration
Neural Networks
And Much More ....
13-13 Wilders Channel Offset Trading System for Amibroker (AFL)
Rating:
3 / 5 (Votes 6)
Tags:
trading system, amibroker, exploration
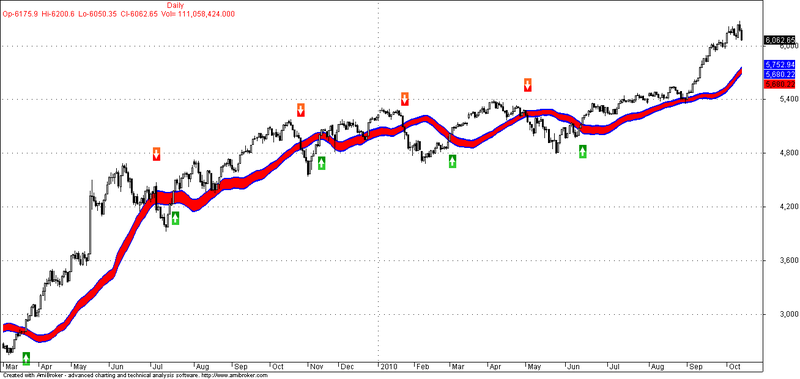
Here is an another customized code similar to 5-13 EMA-Offset Channel Trading system. Here Instead of EMA we are using wilders moving average to filter the noise signals and to make the trading system better than 5-13 EMA-Offset Channel Trading system and to produce a distant signals compared to 5-13 EMA-Offset Channel trading system
Buy and Sell Rules are Simple
1)Buy if the candle closes above the EMA Offset cloud
2)Sell if the candle closes below the EMA offset cloud
3)Trailing stop loss is Lower Cloud Value in case of Buy Signal and Upper Cloud value in case of Sell signal
Screenshots
Similar Indicators / Formulas
OPTIMIZED ICHIMOKU
Submitted
by ritesh.bafna88 over 11 years ago
Reaction Trend System
Submitted
by ajayjain90 almost 14 years ago
Behgozin Strength Finder
Submitted
by hotaro3 over 11 years ago
KPL with RSI
Submitted
by pdkg_gal almost 14 years ago
Intraday Trend Break System
Submitted
by nishantndk almost 14 years ago
ema crossovers
Submitted
by rushee.g1100 over 13 years ago
Indicator / Formula
Copy & Paste Friendly
/* Done      by    Rajandran R */
/* Author of www.marketcalls.in  */

_SECTION_BEGIN("13-13 Wilders Channel Offset Trading System ");
SetChartOptions(0,chartShowArrows|chartShowDates);
_N(Title = StrFormat("{{NAME}} - {{INTERVAL}} {{DATE}} Open %g, Hi %g, Lo %g, Close %g (%.1f%%) {{VALUES}}", O, H, L, C, SelectedValue( ROC( C, 1 ) ) ));
Plot( C, "Close", ParamColor("Color", colorBlack ), styleNoTitle | ParamStyle("Style") | GetPriceStyle() );


A = Wilders( H,13 );
B = Wilders( L,13 );


x= Ref(A,-13);
y= Ref(B,-13);

D=.0009;
xt=x+x*D;
xb=x-x*D;

yt=y+y*D;
yb=y-y*D;

/* Buy or Sell Condition */
Buy = Cross(Close,xt);
Sell = Cross(yt,Close);
Buy = ExRem(Buy,Sell);
Sell = ExRem(Sell,Buy);

Filter = Buy OR Sell;
/* Exploration Parameters */
AddTextColumn( FullName(), "Company Name" );
AddColumn( Buy, "Buy", 1 );
AddColumn( Sell, "Sell", 1 );
AddColumn( C, "Close", 1.3 );
AddColumn( H, "High", 1.3 );

/* Plotting the Channel Cloud */

PlotOHLC( 0,xt,xb,xb ,"",colorBlue, styleCloud);
PlotOHLC( 0,yt,yb,yb ,"",colorBlue, styleCloud);
PlotOHLC( 0,xt,yb,yb ,"",colorRed, styleCloud);

Title = EncodeColor(colorWhite)+ "5-13 EMA Channel Trading System" + " - " +  Name() + " - " + EncodeColor(colorRed)+ Interval(2) + EncodeColor(colorWhite) +
 "  - " + Date() +" - "+"\n" +EncodeColor(colorRed) +"Op-"+O+"  "+"Hi-"+H+"  "+"Lo-"+L+"  "+
"Cl-"+C+"  "+ "Vol= "+ WriteVal(V)+"\n"+
EncodeColor(colorLime)+
WriteIf (Buy , " GO LONG / Reverse Signal at "+C+"  ","")+
WriteIf (Sell , " EXIT LONG / Reverse Signal at "+C+"  ","")+"\n"+EncodeColor(colorWhite)+
WriteIf(Sell , "Total Profit/Loss for the Last Trade Rs."+(C-BuyPrice)+"","")+
WriteIf(Buy  , "Total Profit/Loss for the Last trade Rs."+(SellPrice-C)+"","");

PlotShapes(IIf(Buy, shapeSquare, shapeNone),colorGreen, 0, L, Offset=-40);
PlotShapes(IIf(Buy, shapeSquare, shapeNone),colorLime, 0,L, Offset=-50);
PlotShapes(IIf(Buy, shapeUpArrow, shapeNone),colorWhite, 0,L, Offset=-45);
PlotShapes(IIf(Sell, shapeSquare, shapeNone),colorRed, 0, H, Offset=40);
PlotShapes(IIf(Sell, shapeSquare, shapeNone),colorOrange, 0,H, Offset=50);
PlotShapes(IIf(Sell, shapeDownArrow, shapeNone),colorWhite, 0,H, Offset=-45);
_SECTION_END();
0 comments
Leave Comment
Please login here to leave a comment.
Back