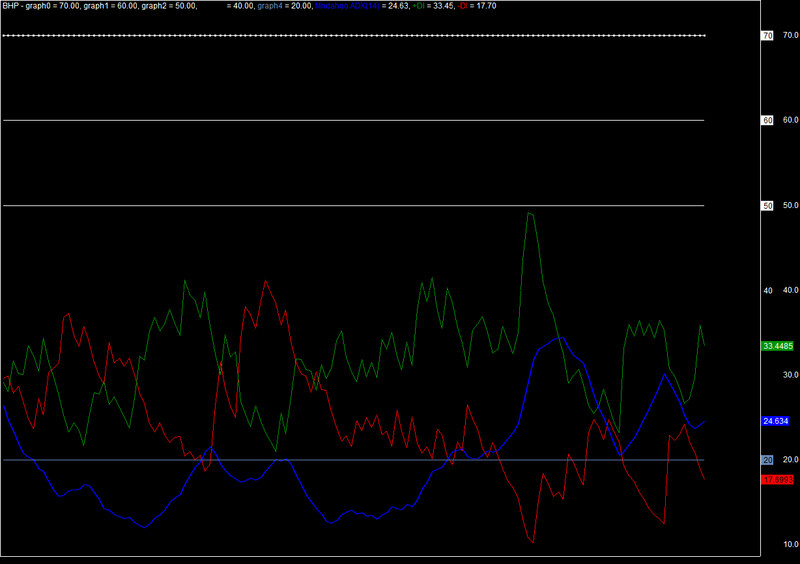
Mndahoo ADX 2 for Amibroker (AFL)
I am new 2 technical student.
Here is a screenshot of how the indicator looks:
Submitted by Kabir over 2 years ago
Similar Formulas
Formula
_SECTION_BEGIN("Mndahoo ADX");
//------------------------------------------------------------------------------
//
// Formula Name: Mndahoo ADX
// Author/Uploader: Ahmed Mohammed Al-asmari - alkukab [at] yahoo.com
// E-mail:
// Date/Time Added: 2006-10-16 23:44:21
// Origin:
// Keywords: Mndahoo ADX
// Level: advanced
// Flags: indicator
// Formula URL: http://www.amibroker.com/library/formula.php?id=744
// Details URL: http://www.amibroker.com/library/detail.php?id=744
//
//------------------------------------------------------------------------------
//
// Average Directional Index (ADX):
//
// --------------------------------
//
// the Average Directional Index (ADX) in order to evaluate the strength of
// the current trend, be it up or down. It's important to determine whether
// the market is trending or trading (moving sideways), because certain
// indicators give more useful results depending on the market doing one or
// the other.
//
// ADX is an oscillator that fluctuates between 0 and 100. Even though the
// scale is from 0 to 100, readings above 60 are relatively rare. Low
// readings, below 20, indicate a weak trend and high readings, above 40,
// indicate a strong trend. The indicator does not grade the trend as bullish
// or bearish, but merely assesses the strength of the current trend. A
// reading above 40 can indicate a strong downtrend as well as a strong
// uptrend.
//
// ADX can also be used to identify potential changes in a market from
// trending to non-trending. When ADX begins to strengthen from below 20
// and/or moves above 20, it is a sign that the trading range is ending and a
// trend could be developing.
//
//------------------------------------------------------------------------------
// By Ahmed Mohammed Al-asmari
//-----------------------------------------------------------------------------------------------------------------
MaxGraph =10;
//---------------------
Graph0 = 70;
Graph1 = 60;
Graph2 = 50;
Graph3 = 40;
Graph4 = 20;
//---------------------
Graph0Color = 2 ;
Graph1Color = 2;
Graph2Color = 2;
Graph3Color = 1;
Graph4Color = 3;
//---------------------
Graph0Style = 13;
Graph1Style = 1;
Graph2Style = 1;
Graph3Style = 1;
Graph4Style = 1;
//Graph5Style = 1;
//-----------------------------------------------------------------------------------------------------------------
range = Param("Periods", 14, 2, 200, 1 );
Plot( ADX(range), _DEFAULT_NAME(), ParamColor( "ADX color", colorBlue ), ParamStyle("ADX style", styleThick ) );
Plot( PDI(range), "+DI", ParamColor( "+DI color", colorGreen ), ParamStyle("+DI style") );
Plot( MDI(range), "-DI", ParamColor( "-DI color", colorRed ), ParamStyle("-DI style") );
//-----------------------------------------------------------------------------------------------------------------
_SECTION_END();
0 Comments
Please login here to leave a comment.