Stock Portfolio Organizer
The ultimate porfolio management solution.
WiseTrader Toolbox
#1 Selling Amibroker Plugin featuring:
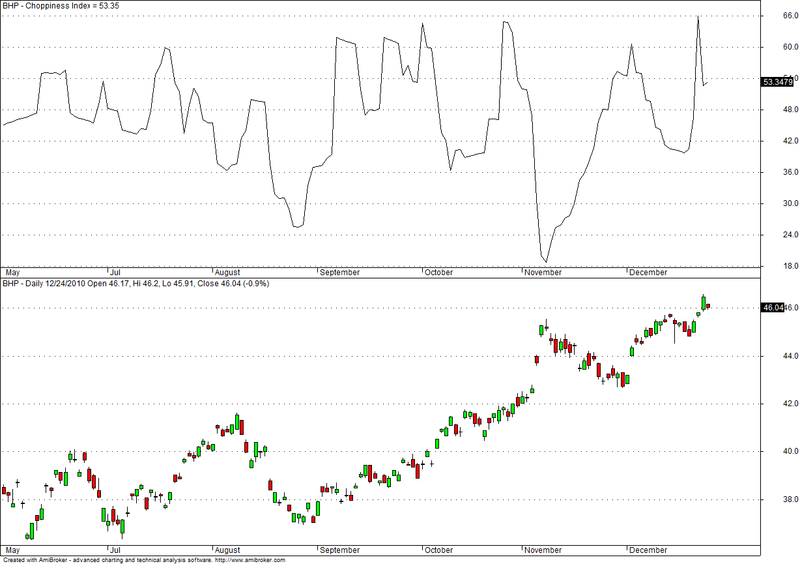
Choppiness index for Amibroker (AFL)
Bill Dreiss’ Choppiness Index.
AFL Implementation by Robert D. Angerer
References: Futures Magazine, October 1993, article by Gibbons Burke “Measuring market choppiness with chaos” Commodity Traders Consumer Report, July/August, 1992, Bill Dreiss “The Fractal Wave Algorithm, Charts And Systems”
Concept:
====
Choppiness Index is a measure of price congestion or trending, similar to the Vertical Horizontal Filter.
Imagine drawing a rectangle around a number of market days (Say, 14 days.) The top of the box lies at the Highest High during those 14 days AND the bottom of the box lies at the Lowest price Low during the 14 Day period. Imagine the price bars comprise “Ink on paper”. The Choppiness Index measures the ratio of “Ink” within the rectangular price box to the total area of the box.
In a “Trendy” market, there will be less ink in relationship to the white space on the paper (a lower CI reading). During choppy, trendless market phases, there will be more ink relative to the boxed area (higher CI).
Stated another way, a Short box constitutes a consolidation range. A tall box constitutes a strongly trending market.
The CI is simply a mathematical measure of this relationship.
(Choppiness Index is very similar in concept to the Vertical Horizontal Filter, only with an inverse scale).
Usage:
==
The CI measures the relationship between the Sum of daily trading ranges during a given period of time against the total range for that period. Low readings in the CI correspond closely with the end of strong impulsive movements either up OR down, while High readings occur after significant consolidations in the price. Extended periods of trendless price movement are reflected in extended periods of above-average readings of the CI. Bill Dreiss says "high CI readings can be used to indicate that a consolidation is about to end and a position should be entered or a breakout anticipated. (Since the CI reading has nothing to do with market direction, it does NOT indicate in which direction to expect the breakout, but that the breakout will probably be followed by a significant move.) In this respect, the CI is similar in usage to Bollinger Band width (%B).
Screenshots
Similar Indicators / Formulas
Indicator / Formula
range = Param("Periods", 14, 5, 252, 1 );
MaxH = Max(H, Ref(C, -1));
MinL = Min(L, Ref(C, -1));
HMax = HHV(MaxH, range);
LMax = LLV(MinL, range);
TR = ATR(range);
SumTR = (Sum(TR,range)) / (HMax - LMax);
logsum = log10(SumTR);
LOGn = log10(range);
Choppiness = 100 * logsum / LOGn;

Plot (Choppiness, "Choppiness Index", colorBlack, styleLine);
0 comments
Leave Comment
Please login here to leave a comment.
Back