Stock Portfolio Organizer
The ultimate porfolio management solution.
Shares, Margin, CFD's, Futures and Forex
EOD and Realtime
Dividends and Trust Distributions
And Much More ....
WiseTrader Toolbox
#1 Selling Amibroker Plugin featuring:
Advanced Adaptive Indicators
Advanced Pattern Exploration
Neural Networks
And Much More ....
SUN AND CLOUD for Amibroker (AFL)
Rating:
4 / 5 (Votes 4)
Tags:
amibroker
by boufalo 17-1-2011
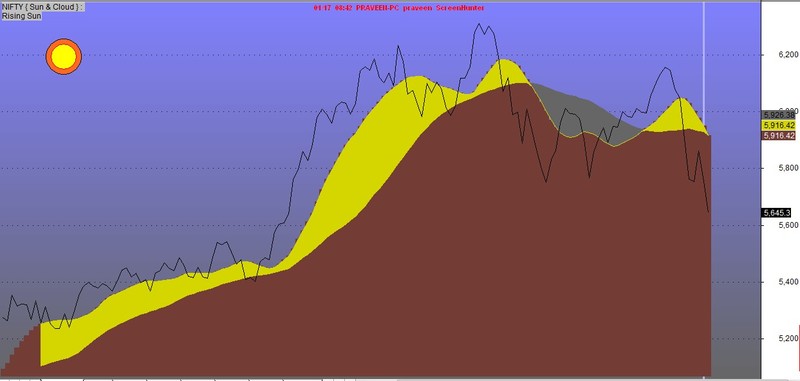
Sun & Cloud System based on idea of ICHIMOKU CHART
Reading of the chart,
1.for long term investors,
a.Bullish when you see the sun(Yellow zone)
b.Bearish when you see the dark cloud(Black
zone)
c.Turning point from bullish to bearish:When
red line break into the yellow zone.
d.Turning point from bearish to bullish: When
red line break through the dark cloud.
2.for short term trading,
reading the changes between the white line and
the red line
THANKS TO MR . BOUFALO FOR SHARING THIS AFL
Screenshots
Similar Indicators / Formulas
Kavach Of Karna v2
Submitted
by hbkwarez almost 10 years ago
Advanced Elliott Waves
Submitted
by MarcosEn over 12 years ago
3_6Day GuaiLiLv
Submitted
by motorfly over 12 years ago
Williams Alligator System
Submitted
by durgesh1712 over 12 years ago
Interactive Linear Regression Channel
Submitted
by InternetWorm over 12 years ago
*Level Breakout system*
Submitted
by Tinych over 12 years ago
Indicator / Formula
Copy & Paste Friendly
_SECTION_BEGIN("Sun & Cloud_i");
// by boufalo 13-1-2011
// Sun & Cloud System based on idea of ICHIMOKU CHART
/*
Reading of the chart,
1.for long term investors,
a.Bullish when you see the sun(Yellow zone)
b.Bearish when you see the dark cloud(Black
zone)
c.Turning point from bullish to bearish:When
red line break into the yellow zone.
d.Turning point from bearish to bullish: When
red line break through the dark cloud.
2.for short term trading,
reading the changes between the white line and
the red line
*/

Long2 =EMA( ( HHV( H, 20 ) + LLV( L, 20) )/2,20);
Long1 =EMA( ( HHV( H, 5 ) + LLV( L, 5) )/2,10);
K=(H+2*C+L)/4;
Z=  ( HHV( H, 3 ) + LLV( L, 3) )/2 ;
SP=IIf(K>=Z*1.05,1.10*Z,IIf(K<Z*1.05 AND K>=Z,1.0*Z,IIf(K<Z,0.9*Z,0.9*Z)));
M=IIf(Long1>long2,Long2,Long1);

Plot(C,"Close",colorBlack,styleLine);

SetChartBkGradientFill( ParamColor("Sky",ColorRGB( 128, 128, 255 )),ParamColor("Sky lower", colorGrey40),ParamColor("Text", colorLightGrey));
PlotOHLC( Long1 ,  Long1 ,  m, Long1 ," ", ParamColor("Left Side",ColorRGB( 213, 213, 0 )),styleCloud );
PlotOHLC( Long2 ,  Long2 ,  m, Long2 ," ", colorGrey40,styleCloud );
PlotOHLC( Long1 ,  Long1 ,  m, Long1 ," ", ParamColor("Land",ColorRGB( 115, 61, 54 )),styleArea );

Title=Name() + " { Sun & Cloud } : \n"+WriteIf(Long1>long2,"Rising Sun","Dark Cloud Cover");

GfxSelectSolidBrush(colorOrange);
GfxCircle( 100, 85 , 28 );
GfxSelectSolidBrush(colorYellow);
GfxSelectPen( colorRed );
GfxCircle( 100, 85 , 20 );
_SECTION_END();
4 comments
Leave Comment
Please login here to leave a comment.
Back
I have just set it up and it looks very exciting.
I will test it in the next couple of days.
Can you please elaborate on the directions for the short term traders?
Because, I don’t see any white or red lines. What all I see is the black
line piercing in and out of Yellow, Grey and Dark brown regions.
Your directions will be helpful in understanding the AFL in clearer terms.
Thanks, boufalo!
- Murthy
wow……wow
Dear Sajid, are you sure that this afl is completely ok? I searched on internet and found some other versions with not only a different “look” but also a different result. Can I have your email please? Thanks in advance!
very nice!
Thank You