Stock Portfolio Organizer
The ultimate porfolio management solution.
Shares, Margin, CFD's, Futures and Forex
EOD and Realtime
Dividends and Trust Distributions
And Much More ....
WiseTrader Toolbox
#1 Selling Amibroker Plugin featuring:
Advanced Adaptive Indicators
Advanced Pattern Exploration
Neural Networks
And Much More ....
Customise Candles for Amibroker (AFL)
Rating:
5 / 5 (Votes 1)
Tags:
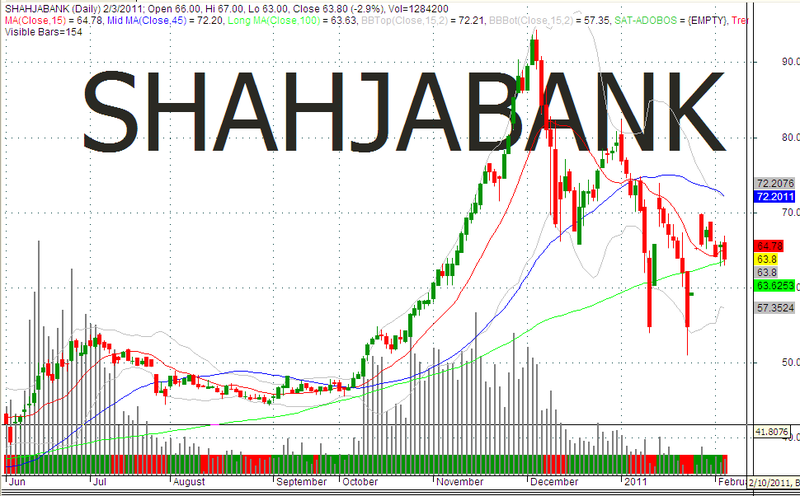
amibroker, trend
This afl help to find the trend in Green and Red zone.
Screenshots
Similar Indicators / Formulas
Super Trend
Submitted
by Arjun almost 14 years ago
Trend Following Indicator
Submitted
by trek about 14 years ago
PROFIT TRADING SYSTEM
Submitted
by Muralikrishna over 10 years ago
Seasionality
Submitted
by saiflingkon almost 13 years ago
Vertical Horizontal Filter
Submitted
by mahesh.aranake about 14 years ago
TrendChart v2.0 by rmike
Submitted
by rmike about 14 years ago
Indicator / Formula
Copy & Paste Friendly
_SECTION_BEGIN("Price");
SetChartOptions(0,chartShowArrows|chartShowDates);
_N(Title = StrFormat("{{NAME}} - {{INTERVAL}} {{DATE}} Open %g, Hi %g, Lo %g, Close %g (%.1f%%) Vol " +WriteVal( V, 1.0 ) +" {{VALUES}}", O, H, L, C, SelectedValue( ROC( C, 1 )) ));
Plot( C, "Close", ParamColor("Color", colorBlack ), styleNoTitle | ParamStyle("Style") | GetPriceStyle() );
if( ParamToggle("Tooltip shows", "All Values|Only Prices" ) )
{
 ToolTip=StrFormat("Open: %g\nHigh:  %g\nLow:   %g\nClose:  %g (%.1f%%)\nVolume: "+NumToStr( V, 1 ), O, H, L, C, SelectedValue( ROC( C, 1 )));
}
_SECTION_END();

_SECTION_BEGIN("MA");
P = ParamField("Price field",-1);
Periods = Param("Periods", 15, 2, 200, 1 );
Plot( MA( P, Periods ), _DEFAULT_NAME(), ParamColor( "Color", colorCycle ), ParamStyle("Style") );
_SECTION_END();

_SECTION_BEGIN("Mid MA");
P = ParamField("Price field",-1);
Periods = Param("Periods", 45, 2, 300, 1 );
Plot( MA( P, Periods ), _DEFAULT_NAME(), ParamColor( "Color", colorCycle ), ParamStyle("Style") );
_SECTION_END();

_SECTION_BEGIN("Long MA");
P = ParamField("Price field",-1);
Periods = Param("Periods", 100, 2, 400, 1 );
Plot( MA( P, Periods ), _DEFAULT_NAME(), ParamColor( "Color", colorCycle ), ParamStyle("Style") );
_SECTION_END();

_SECTION_BEGIN("BBands");
P = ParamField("Price field",-1);
Periods = Param("Periods", 15, 2, 100, 1 );
Width = Param("Width", 2, 0, 10, 0.05 );
Color = ParamColor("Color", colorLightGrey );
Style = ParamStyle("Style") | styleNoRescale;
Plot( BBandTop( P, Periods, Width ), "BBTop" + _PARAM_VALUES(), Color, Style );
Plot( BBandBot( P, Periods, Width ), "BBBot" + _PARAM_VALUES(), Color, Style );
_SECTION_END();

_SECTION_BEGIN("Volume");
Plot( Volume, _DEFAULT_NAME(), ParamColor("Color", colorLavender ), styleNoTitle | ParamStyle( "Style", styleHistogram | styleOwnScale | styleThick | styleNoLabel, maskHistogram  ), 2 );
_SECTION_END();

_SECTION_BEGIN("Price Interpretation");
movshort = ParamField("Short Time MA", 8 );
movmed = ParamField("Mid Time MA", 9 );
movlong = ParamField("Long Time MA", 10 );
btop = ParamField("BBTop", 11 );
bbot = ParamField("BBBottom", 12 );
if( Status("action") == actionCommentary )
{
width = btop - bbot;
lslop = LinRegSlope( C, 30 ) + 100;
lslo = LLV( lslop, 90 );
lshi = HHV( lslop, 90 );
lswidth = lshi - lslo;
trend = 100*( lslop - lslo )/lswidth;

mawidth = MA( width, 100 );
relwidth = 100*(width - mawidth)/mawidth;

_N( tname = Name()+"("+FullName()+")" );

printf("Price and moving averages:\n");
printf( tname + " has closed " + WriteIf( C > movshort, "above" , "below" ) + " its Short time moving average. ");

printf("\nShort time moving average is currently " + WriteIf( movshort > movmed, "above", "below") + " mid-time, AND " + WriteIf( movshort > movlong, "above", "below" ) + " long time moving averages.");

printf("\nThe relationship between price and moving averages is: "+
WriteIf( C > movshort AND movshort > movmed, "bullish",
WriteIf( C < movshort AND movshort < movmed, "bearish", "neutral" ) ) + " in short-term, and "+
WriteIf( movshort > movmed AND movmed > movlong , "bullish",
WriteIf( movshort < movmed AND movmed < movlong, "bearish", "neutral" ) ) + " in mid-long term. ");

printf("\n\nBollinger Bands:\n");
printf(tname+ " has closed " +
WriteIf( C < bbot, "below the lower band by " +
WriteVal( 100 *( bbot-C )/ width, 1.1 ) + "%%. " +
WriteIf( trend < 30, " This combined with the steep downtrend can suggest that the downward trend in prices has a good chance of continuing.  However, a short-term pull-back inside the bands is likely.",
WriteIf( trend > 30 AND trend < 70, "Although prices have broken the lower band and a downside breakout is possible, the most likely scenario for "+tname+" is to continue within current trading range.", "" ) ), "" ) +

WriteIf( C > btop, "above the upper band by " +
WriteVal( 100 *( C- btop )/ width, 1.1 ) + "%%. " +
WriteIf( trend > 70, " This combined with the steep uptrend suggests that the upward trend in prices has a good chance of continuing.  However, a short-term pull-back inside the bands is likely.",
WriteIf( trend > 30 AND trend < 70, "Although prices have broken the upper band and a upside breakout is possible, the most likely scenario for "+tname+" is to continue within current trading range.", "" ) ), "" ) +

WriteIf( C < btop AND ( ( btop - C ) / width ) < 0.5,
"below upper band by " +
WriteVal( 100 *( btop - C )/ width, 1.1 ) + "%%. ",
WriteIf( C < btop AND C > bbot , "above bottom band by " +
WriteVal( 100 *( C - bbot )/ width, 1.1 ) + "%%. ", "" ) ));

printf("\n"+
WriteIf( ( trend > 30 AND trend < 70 AND ( C > btop OR C < bbot ) ) AND abs(relwidth) > 40,
		 "This picture becomes somewhat unclear due to the fact that Bollinger Bands are  currently",
		 "Bollinger Bands are " )+
WriteVal( abs( relwidth ), 1.1 ) + "%% " +
WriteIf( relwidth > 0, "wider" , "narrower" ) +
" than normal.");

printf("\n");

printf(
WriteIf( abs( relwidth ) < 40, "The current width of the bands (alone) does not suggest anything conclusive about the future volatility or movement of prices.","")+
WriteIf( relwidth < -40, "The narrow width of the bands suggests low volatility as compared to " + tname + "'s normal range.  Therefore, the probability of volatility increasing with a sharp price move has increased for the near-term. "+
"The bands have been in this narrow range for " + WriteVal(BarsSince(Cross(-40,relwidth)),1.0) + " bars. The probability of a significant price move increases the longer the bands remain in this narrow range." ,"")+
WriteIf( relwidth > 40, "The large width of the bands suggest high volatility as compared to " + tname + "'s normal range.  Therefore, the probability of volatility decreasing and prices entering (or remaining in) a trading range has increased for the near-term. "+
"The bands have been in this wide range for  " + WriteVal(BarsSince(Cross(relwidth,40)),1.0) + " bars.The probability of prices consolidating into a less volatile trading range increases the longer the bands remain in this wide range." ,""));

printf("\n\nThis commentary is not a recommendation to buy or sell. Use at your own risk.");
}
_SECTION_END();
_SECTION_BEGIN("Name");
GfxSetOverlayMode(1);
GfxSelectFont("Tahoma", Status("pxheight")/6 );
GfxSetTextAlign( 6 );// center alignment
GfxSetTextColor( ColorHSB( 42, 42, 42 ) );
GfxSetBkMode(0); // transparent
GfxTextOut( Name(), Status("pxwidth")/2, Status("pxheight")/12 );
GfxSelectFont("Tahoma", Status("pxheight")/12 );
GfxSelectFont("Tahoma", Status("pxheight")/36 );
_SECTION_END();
_SECTION_BEGIN("VisibleBars");

SetChartOptions(0, chartShowDates | chartWrapTitle);

last = Status("lastvisiblebar");
first = Status("firstvisiblebar");

VisibleBars = Min( last - first, BarCount - first );

_N(Title = StrFormat("{{NAME}} ({{INTERVAL}}) {{DATE}}; {{OHLCX}}, Vol=%1.0f\n{{VALUES}}\nVisible Bars=%1.0f", V, VisibleBars));

Plot(C, "", colorLightGrey, styleBar);

_SECTION_END();
//berikut indicator saya namankan SAT-ADOBOS(Acc& Dist-Overbought& Sold

_SECTION_BEGIN( "SAT-ADOBOS" );
line1=H-L;
line2=IIf(line1=0,1,line1) ;
ad=((C-L)-(H- C))/line2;
line3=ad*V;
line4=Sum(line3, 5)/Sum(V, 5);
line5=MA(line4, 3);
Plot(line5, "SAT-ADOBOS" ,colorLime , styleHistogram| styleThick) ;
uptrend=StochK( 5)>30;
downtrend=StochK( 5)<40;
Plot( 4, "Trend",IIf( uptrend, colorGreen, IIf( downtrend, colorRed, 0 )),styleOwnScale| styleArea| styleNoLabel, -0.5, 100 );

/* Pak Eco yg ahli warna-warni mungin bisa membantu nya or tman se-oprekan
strategy trading yg Saya menggunakan 2 kekuatan Oscilator pertama kekuatan A/D kedua kekuatan Harga dan disini
A/D ini telah saya kombinasikan dgn stochastic sbg ribbon
bila kondisi dalam Acc Histo naik dan di dukung Oleh ribbon stoch menjadi Hijau dpt dikatakan Buy Signal dan sebaliknya.
kunci dari A/D ini terdapat bilamana nilai bar Hari ini > or < dari pd nilai bar Hari kemarin berarti ada progress kenaikan / penurunan.

Ok.... sekarang bgm Caranya untuk buat Histogramnya menjadi waran warni , bila
berada di bawah merah dan di atas Hijau.
dan agar lebih jelas dibaca klu bs di buat dgn metode sbb :
bila kondisi dlm Acc dan nilai bar Hari ini > dari bar kemarin MAka bar Hari ini Hijau terang.
dan bila kondisi dlm Acc dan nilai bar Hari ini < dari bar kemarin MAka bar Hari ini Hijau gelap.
begitu juga sebaliknya saat terjadi distribusi berarti histo berada di bawah.
bila kondisi dlm Dist dan nilai bar Hari ini > dari bar kemarin MAka bar Hari ini merah terang.
dan bila kondisi dlm Dist dan nilai bar Hari ini < dari bar kemarin MAka bar Hari ini merah tua.
itu dapat diartikan kondisi bearish menuju ke bulish dan sebaliknya.
*/

_SECTION_END( );
0 comments
Leave Comment
Please login here to leave a comment.
Back