Vier 4P Analysis for Amibroker (AFL)
Bonkers over 16 years ago Amibroker (AFL)
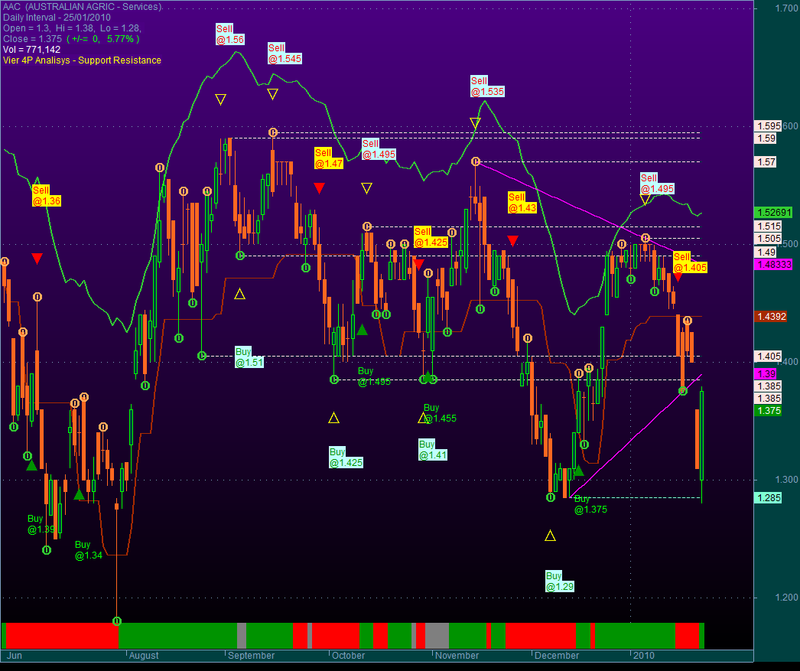
This is a very sophisticated price chart that allows you to show and hide a variety of indicators and systems, which includes pivots, bollinger bands, Jimberg and many others.
Screenshots
You cannot view the code for the following reasons:
- You must be a member and have contributed at least 1 indicator
66 comments
Leave Comment
Please login here to leave a comment.
To make the formula look like the picture above. Go to parameters for the indicator and enable the Jimberg indicator.
Good one thankd
if i cannot create a formula. Will be still able to see the formula? thank you
No you won’t i’m afraid. You need to contribute something.
I already contribute 3 formula but i cant find Pathfinder or others afl, admin regards.
Hello
You submitted duplicates with very bad descriptions that’s why they where not approved.
nice indicator …….
Depends on Future quotes be careful.
Guys I downloaded the formula and tried to use it but ıt dıdnt look anythıng lıke the graph above I copied formula and pasted ınto formula edıtor and applied what I see is only price not else .Am I doıng somethıng wrong or is there anythıgn else more you should recommend me to do make ıt look lıke the graph above?
newagetk, all the above you see needs to be enable via parameters.
Excellent indicator….Thnx goes to Bonkers….
when i installed this afl i didn’t find any thing. then from parameters i made change show/hide of various indicators….now it is as i was wanted.
This can b our one of the master afl.
Thnx again.
good g
good trade
how could i enable via parameters?
good
cảm ơn bác
very nice
nice indicator but mine shows line charts instead of candle sticks. i need help here. tx
gooooooooooooooooooooooood
v good alf very nice
i new here not expert to give a afl.
my point is the message shown-
“You must be a member to view this formula and have contributed at least 1 formulas. Please login or register”
then how can i get this afl
thank you
thank you
I WANT the AFL FOR THIS
hi admin
I hav already contributed 1 formula
thn to I hav no acces to ur formula
plz reply
I WANT the AFL FOR THIS
how do me see it ??
goooooooooooooooooooooood
i have contribute two indicator but unble to see the afl. pls do the needful
where is afl
Chart shown in the picture is for Jimberg Indicator which looks into future….so very late and unrealistic signals produced…
thank you
thank you
thank you
thank you
plz any can help me ,i wanna this afl .
I am very much shocked to see the afl, i thought it will brings more logical or good indicator but there is nothing to get from it, in real world do u think we have much time to change the parameters and see what happening in every parameters. Is.it ok in every Buy/Sell signal. There are lots of Buy/Sell signal which one i have to take……..
nice traing system.
The bollinger hide the candle, we can change line 308 to 322 by :
hi!
thanks for share.
Thank you
Thank you
Thank you
All works good but there is an error in Stocastic saying pMinMax not initialized. How to overcome this?
How can you have this afl, lienshi, when your indicator contributions are zero?
Very good
thank you
Good one thankd
SIMPLY SUPERB…THANKS DEAR ADMIN.
How to view the afl, seniors guide plz
Good one thankd
very good work
Thanks
one of the best afl of this forum. I cant analyze stock without this indicator. Thank author and thank admin too….specially to gauge trend and support resistance. Clustering of support resistance nicely indicates the possible future move…
it isn’t avaible!!
thanks
Thank you
Thank you
i need this afl how to download can any one help me vjvijay88@yahoo.com….
thanks in advance
Good
nice afl
thank
Thnaks you!
thanks you
làm sao để xem được các ngài