Stock Portfolio Organizer
The ultimate porfolio management solution.
Shares, Margin, CFD's, Futures and Forex
EOD and Realtime
Dividends and Trust Distributions
And Much More ....
WiseTrader Toolbox
#1 Selling Amibroker Plugin featuring:
Advanced Adaptive Indicators
Advanced Pattern Exploration
Neural Networks
And Much More ....
False Trade Deletion for Amibroker (AFL)
Rating:
2 / 5 (Votes 5)
Tags:
amibroker
Simple way to avoid negative trade and set good prfit…
Assign two charts and set another value as 46.1… Trade if both signal were same otherwise dont..
Screenshots
Similar Indicators / Formulas
Kavach Of Karna v2
Submitted
by hbkwarez almost 10 years ago
Advanced Elliott Waves
Submitted
by MarcosEn over 12 years ago
3_6Day GuaiLiLv
Submitted
by motorfly over 12 years ago
Williams Alligator System
Submitted
by durgesh1712 over 12 years ago
Interactive Linear Regression Channel
Submitted
by InternetWorm over 12 years ago
*Level Breakout system*
Submitted
by Tinych over 12 years ago
Indicator / Formula
Copy & Paste Friendly
////////////////////////////////////////////////////////////////////////////////////
_SECTION_BEGIN( "Chart Settings" );
SetChartOptions( 0, chartShowArrows | chartShowDates );
SetChartBkColor( ParamColor( "Outer Panel", colorDarkGrey ) );
SetChartBkGradientFill( ParamColor( "Upper Chart", colorBlack ), ParamColor( "Lower Chart", colorBlack ) );
_SECTION_END();
Kisa = Param( "KISA GÜN", 12, 0.1, 500, 0.1 );
Uzun = Param( "UZUN GÜN", 43, 0.1, 100, 0.1 );
Tetik = Param( "TETI.K GÜN", 21, 0.1, 50, 0.1 );
_SECTION_BEGIN( "Periodlar" );
function KisaPeriodTopla( Kisa )
{
ka = Kisa;
for ( i = 1; i < Kisa; i++ )
{
ka = ka + i;
}
return ka;
}
function UzunPeriodTopla( Uzun )
{
au = Uzun;
for ( iu = 0; iu < Uzun; iu++ )
{
au = au + iu;
}
return au;
}
function TetikPeriodTopla( Tetik )
{
a = Tetik;
for ( i = 0; i < Tetik; i++ )
{
a = a + i;
}
return a;
}
_SECTION_END();
_SECTION_BEGIN( " Gün Toplamlar?" );
function KisaGunTopla( Kisa )
{
a = Kisa;
kd = a * C;
for ( i = 0;i < Kisa;i++ )
{
b = Ref( C, -i );
if ( a > 0 )
a--;
kd = kd + ( a * b );
}
return kd;
}
function UzunGunTopla( Uzun )
{
au = Uzun;
ku = au * C;
for ( iu = 0;iu < Uzun;iu++ )
{
bu = Ref( C, -iu );
if ( au > 0 )
au--;
ku = ku + ( au * bu );
}
return ku;
}
Period12Toplam = KisaPeriodTopla( Kisa );
Day12Toplam = KisaGunTopla( Kisa );
LWMA12 = Day12Toplam / Period12Toplam;
Period43Toplam = UzunPeriodTopla( Uzun );
Day43Toplam = UzunGunTopla( Uzun );
LWMA43 = Day43Toplam / Period43Toplam;
_SECTION_END();
_SECTION_BEGIN( " TSR HESAPLANMASI" );
function XDAY( Tetik )
{
X = ( ( 2 * LWMA12 ) - LWMA43 );
aX = Tetik;
kX = AX * X;
for ( iX = 0;iX < Tetik;iX++ )
{
bX = Ref( X, -iX );
if ( aX > 0 )
aX--;
kX = kX + ( aX * bX );
}
return kX;
}
XDayToplam = XDAY( Tetik );
XPeriodToplam = TetikPeriodTopla( Tetik );
TSR = ( XDayToplam / XPeriodToplam );
_SECTION_END();
_SECTION_BEGIN( " EKRANA BASMA I.S,LEMI." );
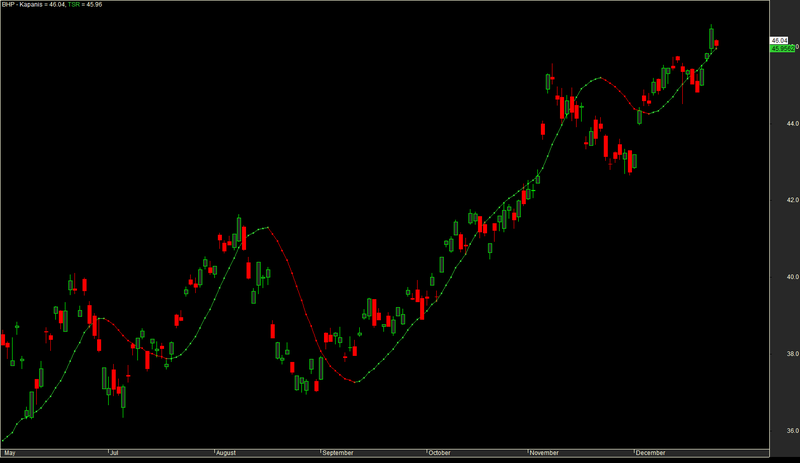
Plot( C, "Kapanis", colorWhite, styleCandle );
tsrcolor = IIf( TSR > Ref( TSR, -1 ), colorLime, colorRed );
Plot( TSR, "TSR", tsrcolor, styleDots + styleLine );
_SECTION_END();
_SECTION_BEGIN( "EXPLORATION" );
//AL=TSR>Ref(TSR,-1);
//SAT=Ref(TSR,-1)>TSR;
AL = Cross( C, TSR );
SAT = Cross( TSR, C );
AL_status = WriteIf( AL, "Al?s, Yap", " " );
SAT_status = WriteIf( SAT, "Sat?s, Yap", " " );
AL_Col = IIf( AL, colorDarkGreen , colorWhite );
SAT_Col = IIf( SAT, colorRed, colorWhite );
Filter = AL OR SAT;
AddColumn( C, "KAPANIS,", 1.2, IIf( C > Ref( C, -1 ), colorBlue, colorRed ) );
AddTextColumn( AL_status, "TSR ALIS,", 1.2, colorWhite, AL_col );
AddTextColumn( SAT_status, "TSR SATIS,", 1.2, colorWhite, SAT_col );
_SECTION_END();
////////////////////////////////////////////////////////////////////////////////////6 comments
Leave Comment
Please login here to leave a comment.
Back
Good Chart prepared.
What is the meaning of ‘KAPANIS’, ‘TSR ALIS’, ‘TSR SATIS’.
“Assign two charts and set another value as 46.1… Trade if both signal were same otherwise dont..”
above is incomplete statement. ‘set another value at 46.1…’ what one has to understand?
Thanks
What do these mean?
KISA GUN
uZEN GUN
TETI.K GUN
thanks
Please post a complete description of interpretation of the formula.
// would have been easier to write the 6 functions into 2 or 1 function(s) or
// or better to write it like this:
SetChartOptions( 0, chartShowArrows | chartShowDates );
_SECTION_BEGIN(“TSR”);
Kisa=Param(“KISA GÜN”,12,0.1,500,0.1);
Uzun=Param(“UZUN GÜN”,43,0.1,100,0.1);
Tetik=Param(“TETIK GÜN”,21,0.1,50,0.1);
TSR = WMA-WMA, Tetik);
Plot(TSR, _DEFAULT_NAME() , IIf( TSR > Ref( TSR, -1 ), colorLime, colorRed ), styleDots);
Plot( C, “Close”, colorBlack, styleCandle );
_SECTION_END();
_SECTION_BEGIN( “EXPLORATION” );
AL = Cross( C, TSR );
SAT = Cross( TSR, C );
AL_status = WriteIf( AL, “Alis Yap”, " " );
SAT_status = WriteIf( SAT, “Satis Yap”, " " );
AL_Col = IIf( AL, colorDarkGreen , colorWhite );
SAT_Col = IIf( SAT, colorRed, colorWhite );
Filter = AL OR SAT;
AddColumn( C, “KAPANIS”, 1.2, IIf( C > Ref( C, -1 ), colorBlue, colorRed ) );
AddTextColumn( AL_status, “TSR ALIS”, 1.2, colorWhite, AL_col );
AddTextColumn( SAT_status, “TSR SATIS”, 1.2, colorWhite, SAT_col );
_SECTION_END();
another try… line not displayed properly….
the TSR line should be
TSR = WMA[ 2*WMA(C,Kisa)-WMA, Tetik ];
replace the [] with ()
This comment system eats characters.
see if this works
“TSR = WMA-WMA, Tetik);”