AGet XTL Candle for Amibroker (AFL)
amon over 15 years ago Amibroker (AFL)
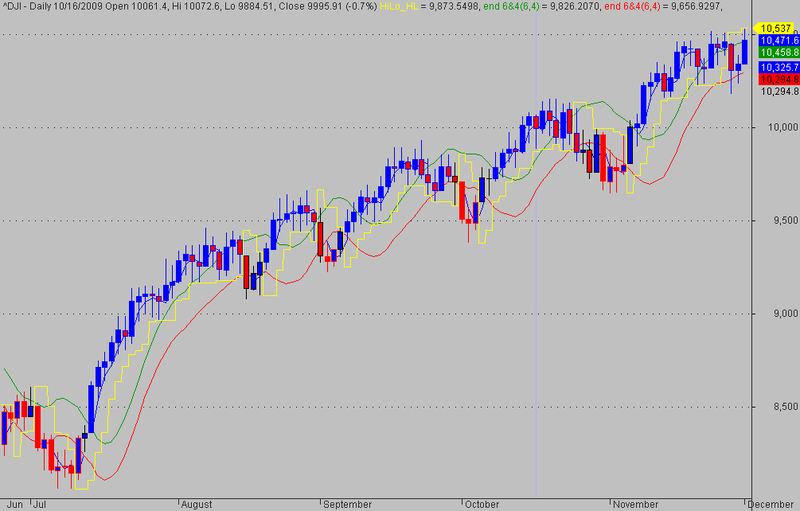
A beautiful Trading System.
Screenshots
Indicator / Formula
Copy & Paste Friendly
_SECTION_BEGIN("SwingN R");
//Franck LAMOTTE - 01/2010

SetChartBkColor(ParamColor("Outer panel color ",colorLightGrey)); // color of outer border
SetChartOptions(0,chartShowArrows|chartShowDates);
_N(Title = StrFormat("{{NAME}} - {{INTERVAL}} {{DATE}} Open %g, Hi %g, Lo %g,
Close %g (%.1f%%) Vol " +WriteVal( V, 1.0 ) +"{{VALUES}}", O, H, L, C, SelectedValue( ROC( C, 1 )) ));

n1 = Param("n1",3,2,4,1);
n2 = Param("n2",4,3,7,1);

//SWING FORMULA//
function HiLo_HL(no) {
res=HHV(H,no);
sup=LLV(L,no);
avd=IIf(C>Ref(res,-1),1,IIf(C<Ref(sup,-1),-1,0));
avn=ValueWhen(avd!=0,avd,1);
tsl=IIf(avn==1,sup,res);
return tsl;
}
Plot(HiLo_HL(n1),"HiLo_HL",colorYellow,styleStaircase);
Buy1=Cross(C,HiLo_HL(n1)) & H>Ref(H,-1) & L>Ref(L,-1);
Sell1=Cross(HiLo_HL(n1),C);
shape=Buy1*shapeUpArrow + Sell1*shapeDownArrow;
if(ParamToggle("Shape System 1 : ",  "No|Yes", 0)){PlotShapes(shape,IIf(Buy1,colorBrightGreen,colorRed),0,IIf(Buy1,Low,High));}


_SECTION_BEGIN("xtl");

SetChartBkColor(ParamColor("Outer panel color ",colorLightGrey));
tgt = 35;
a = CCI(20) < -tgt;
b = CCI(20) > tgt;
state = IIf(a>b,-1,IIf(a==b,0,1));
Color = IIf(state == 0, colorBlack, IIf(state == 1, colorBlue, IIf(state == -1, colorRed, 0)));

//Plot(state, "", color, styleHistogram);

SetChartOptions( 0, chartShowDates | chartShowArrows | chartLogarithmic | chartWrapTitle );
_N(Title = StrFormat("{{NAME}} - {{INTERVAL}} {{DATE}} Open %g, Hi %g, Lo %g, Close %g (%.1f%%) {{VALUES}}", O, H, L, C, SelectedValue( ROC( C, 1 ) ) ));
Plot( C, "Close", color, styleNoTitle |styleCandle );

_SECTION_END();


_SECTION_BEGIN("end 6&4");
Type = ParamList("Type", "Simple,Exponential,Double Exponential,Tripple Exponential,Wilders,Weighted");
Periods = Param("Periods", 6, 2, 300 );
Displacement = Param("Displacement", 4, -50, 50 );
m1 = 0;
m2 = 0;

if( Type == "Simple" ) {
	m1 = MA( H, Periods );
	m2 = MA( L, Periods);
}
if( Type == "Exponential" ) 			{
	m1 = EMA( H, Periods );
	m2 = EMA( L, Periods);
}

if( Type == "Double Exponential" ) 	{
	m1 = DEMA( H, Periods );
	m2 = DEMA( L, Periods);
}

if( Type == "Tripple Exponential" ) 	{
	m1 = TEMA( H, Periods );
	m2 = TEMA( L, Periods);
}

if( Type == "Wilders" ) 				{
	m1 = Wilders( H, Periods );
	m2 = Wilders( L, Periods);
}

if( Type == "Weighted" ) 				{
	m1 = WMA( H, Periods );
	m2 = WMA( L, Periods);
}


Plot( m1, _DEFAULT_NAME(), ParamColor("ColorTop", colorGreen), ParamStyle("Style"), 0, 0, Displacement );
Plot( m2, _DEFAULT_NAME(), ParamColor("ColorBottom", colorRed), ParamStyle("Style"), 0, 0, Displacement );

PlotOHLC(m1,m1,m2,m2,"DMACloud",ParamColor("ColorChannel", colorLightGrey),styleCloud,Null,Null,Displacement);
// Uncomment line below to plot price if Indicator is not overlaid a Price chart
//Plot(C,"Close",colorBlack,styleCandle);


ppl = ParamToggle("Plot Pivot Levels","Off|On",1);
numbars = LastValue(Cum(Status("barvisible")));
fraction= IIf(StrRight(Name(),3) == "", 3.2, 3.2);
hts = -33.5;


/* This code calculates the previous days high, low and close */
Hi1 = IIf(Day()!=Ref(Day(),-1),Ref(HighestSince(Day()!=Ref(Day(),-1),H,1),-1),0);
Hi = ValueWhen(Day()!=Ref(Day(),-1),Hi1,1);
Lo1 = IIf(Day()!=Ref(Day(),-1),Ref(LowestSince(Day()!=Ref(Day(),-1),L,1),-1),0);
Lo = ValueWhen(Day()!=Ref(Day(),-1),Lo1,1);
Cl1 = IIf(Day()!=Ref(Day(),-1),Ref(C,-1),0);
C1 = ValueWhen(Day()!=Ref(Day(),-1),Cl1,1);

//----------------------------------------------------------------------------------

/* This code calculates Daily Piovts */

rg = (Hi - Lo);
bp = (Hi + Lo + C1)/3; bpI = LastValue (bp,1);
r1 = (bp*2)-Lo; r1I = LastValue (r1,1);
s1 = (bp*2)-Hi; s1I = LastValue (s1,1);
r2 = bp + r1 - s1; r2I = LastValue (r2,1);
s2 = bp - r1 + s1; s2I = LastValue (s2,1);
r3 = bp + r2 - s1; r3I = LastValue (r3,1);
s3 = bp - r2 + s1; s3I = LastValue (s3,1);
r4 = bp + r2 - s2; r4I = LastValue (r4,1);
s4 = bp - r2 + s2; s4I = LastValue (s4,1);

if(ppl==1) {
Plot(bp,"",colorBlue,styleLine|styleLine|styleNoRescale);
//Plot(s1,"",colorRed,styleLine|styleNoRescale);
//Plot(s2,"",colorRed,styleLine|styleNoRescale);
//Plot(s3,"",colorRed,styleLine|styleNoRescale);
//Plot(s4,"",colorRed,styleLine|styleNoRescale);
//Plot(r1,"",colorGreen,styleLine|styleNoRescale);
//Plot(r2,"",colorGreen,styleLine|styleNoRescale);
//Plot(r3,"",colorGreen,styleLine|styleNoRescale);
//Plot(r4,"",colorGreen,styleLine|styleNoRescale);
PlotText(" Pivot = " + WriteVal(bp,fraction), LastValue(BarIndex())-(numbars/Hts), bpI +0.05, colorBlue);
PlotText(" r1 = " + WriteVal(r1,fraction), LastValue(BarIndex())-(numbars/Hts), r1I +0.05, colorGreen);
PlotText(" s1 = " + WriteVal(s1,fraction), LastValue(BarIndex())-(numbars/Hts), s1I +0.05, colorRed);
//PlotText(" r2 = " + WriteVal(r2,fraction), LastValue(BarIndex())-(numbars/Hts), r2I +0.05, colorGreen);
//PlotText(" s2 = " + WriteVal(s2,fraction), LastValue(BarIndex())-(numbars/Hts), s2I +0.05, colorRed);
//PlotText(" r3 = " + WriteVal(r3,fraction), LastValue(BarIndex())-(numbars/Hts), r3I +0.05, colorGreen);
//PlotText(" s3 = " + WriteVal(s3,fraction), LastValue(BarIndex())-(numbars/Hts), s3I +0.05, colorRed);
////PlotText(" r4 = " + WriteVal(r4,fraction), LastValue(BarIndex())-(numbars/Hts), r4I +0.05, colorGreen);
//PlotText(" s4 = " + WriteVal(s4,fraction), LastValue(BarIndex())-(numbars/Hts), s4I +0.05, colorRed);
}

_SECTION_END();
4 comments
Leave Comment
Please login here to leave a comment.
Hi Amon,
Guys, you know Aget system costs 2.5 lacks + Rs 8000/ for RT data
Thanks a lot for coding Aget system & sharing it.
This system gives terrific results for daily TF if used it with other trending indicators.
Stoploss is very good, stamping pivot levels is damn good. My rating 5
Viswanath
Hi Amon,
Can u please tell us how to trade using this system.
thanks
Sudha
@kv_maligi,
Vishwanath Sir, is this true….!?
above given code is costing 2.5 lack + 8000 RT data….!!!???
Unbelievable…..!!!
OMG………….
INTRADAY HEIKIN ASHI AND AGET XTL ARE ALMOST SAME.