Stock Portfolio Organizer
The ultimate porfolio management solution.
WiseTrader Toolbox
#1 Selling Amibroker Plugin featuring:
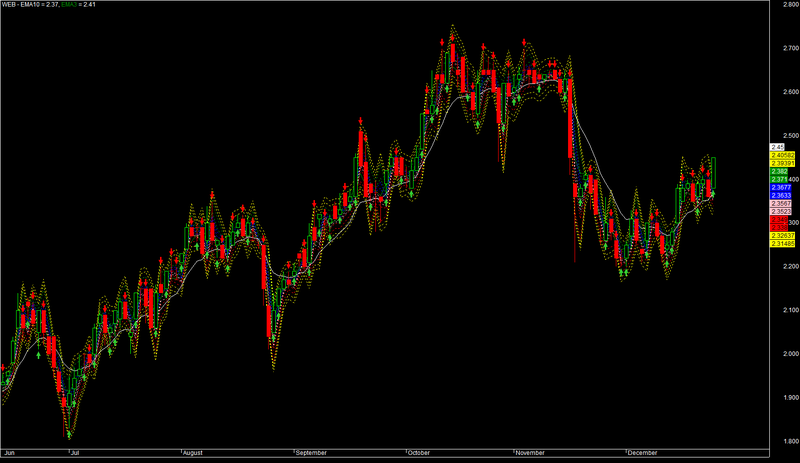
Camarilla Indicator for day trading for Amibroker (AFL)
The well know Camarilla system based trading demystified. This version here uses one of the standard formulas available on the Internet.
Will work in Amibroker 5.3 and above. For lower versions remove the styledashed parameter in the Plot statements.
General rules – go long above R1 and R2, and when S1 is kissed and price moves upwards and short when price goes below S1 and S2 and kisses R1 and comes down.
More information also on my other thread on Traderji.com, including free option for users to trade actively for the Indian Nifty futures along with me using Yahoo Messenger based alerts and my proprietary levels:
http://www.traderji.com/equities/51858-day-trading-nifty-using-camarilla-system-11.html
Screenshots
Similar Indicators / Formulas
Indicator / Formula
_SECTION_BEGIN("Draw Camarilla Levels");
SetChartOptions(0,chartShowArrows|chartShowDates);
showcamarella=ParamList("Show Camarella Lines","YES|NO");
showcandlechart=ParamList("Show Candle chart","YES|NO");
showwhat=IIf(ParamList("Todays or Tomorrows Levels","Today|Tomorrow")=="Tomorrow",1,-1);

if (showcandlechart=="YES")
{
   Plot( C, "Close", ParamColor("Color", colorWhite ), styleNoTitle | ParamStyle("Style") | GetPriceStyle() );
}
EMA10=EMA(C,10);
EMA3=EMA(C,3);
Plot(EMA10,"EMA10", colorWhite,styleLine|styleNoLabel);
Plot(EMA3,"EMA3", colorGreen,styleLine|styleNoLabel);

XH = TimeFrameGetPrice( "H", inDaily,showwhat);
XL = TimeFrameGetPrice( "L", inDaily,showwhat);
XC = TimeFrameGetPrice( "C", inDaily, showwhat );


r2=(((xh-xl)*1.1)/2)+xc;
r1=(((xh-xl)*1.1)/4)+xc;
s1=(xc-((xh-xl)*1.1)/4);
s2=(xc-((xh-xl)*1.1)/2);
n3=1;
tgt1=(1+.005*n3)*r2;
tgt2=(1+.01*n3)*r2;
tgt3=s2/(1+.005*n3);
tgt4=s2/(1+.01*n3);


if (showcamarella=="YES")
{
Plot(r1,"R1",colorGreen,styleLine|styleDashed|styleNoTitle);
Plot(r2,"R2",colorGreen,styleLine|styleDashed|styleNoTitle);
Plot(s1,"S1",colorRed,styleLine|styleDashed|styleNoTitle);
Plot(s2,"S2",colorRed,styleLine|styleDashed|styleNoTitle);
Plot(tgt1,"tgt1",colorYellow,styleLine|styleDashed|styleNoTitle);
Plot(tgt2,"tgt2",colorYellow,styleLine|styleDashed|styleNoTitle);
Plot(tgt3,"tgt3",colorYellow,styleLine|styleDashed|styleNoTitle);
Plot(tgt4,"tgt4",colorYellow,styleLine|styleDashed|styleNoTitle);
Plot(s1+(0.85*(r1-s1)),"int long target 2",colorBlue,styleLine|styleDashed|styleNoTitle);
Plot(s1+(0.65*(r1-s1)),"int long target 1",colorBlue,styleLine|styleDashed|styleNoTitle);
Plot(s1+(0.35*(r1-s1)),"int short target 1",colorPink,styleLine|styleDashed|styleNoTitle);
Plot(s1+(0.15*(r1-s1)),"int short target 2",colorPink,styleLine|styleDashed|styleNoTitle);
Buy=Cross(C,s1) OR Cross(C,r1) OR Cross(C,r2);
Sell=Cross(r1,C) OR Cross(s1,C) OR Cross(s2,C);
shape = Buy * shapeUpArrow + Sell * shapeDownArrow;
PlotShapes( shape, IIf( Buy, colorLime, colorRed ), 0, IIf( Buy, Low, High));
3 comments
Leave Comment
Please login here to leave a comment.
Back
dear administrator, this formula shows syntax error please rectify this
Gangadhar, sorry about that.. Please add } at the end on a new line..
With the parameter setting of yesterday, on the trading day, the AFL will plot Camarilla levels for todays trading. By setting the parameter for tomorrow, you get the Camarilla levels for the next day. Best used with 5/7/12 minute charts.