Stock Portfolio Organizer
The ultimate porfolio management solution.
Shares, Margin, CFD's, Futures and Forex
EOD and Realtime
Dividends and Trust Distributions
And Much More ....
WiseTrader Toolbox
#1 Selling Amibroker Plugin featuring:
Advanced Adaptive Indicators
Advanced Pattern Exploration
Neural Networks
And Much More ....
ADX with multiple Timeframe for Amibroker (AFL)
Rating:
5 / 5 (Votes 1)
Tags:
oscillator, amibroker, timeframe
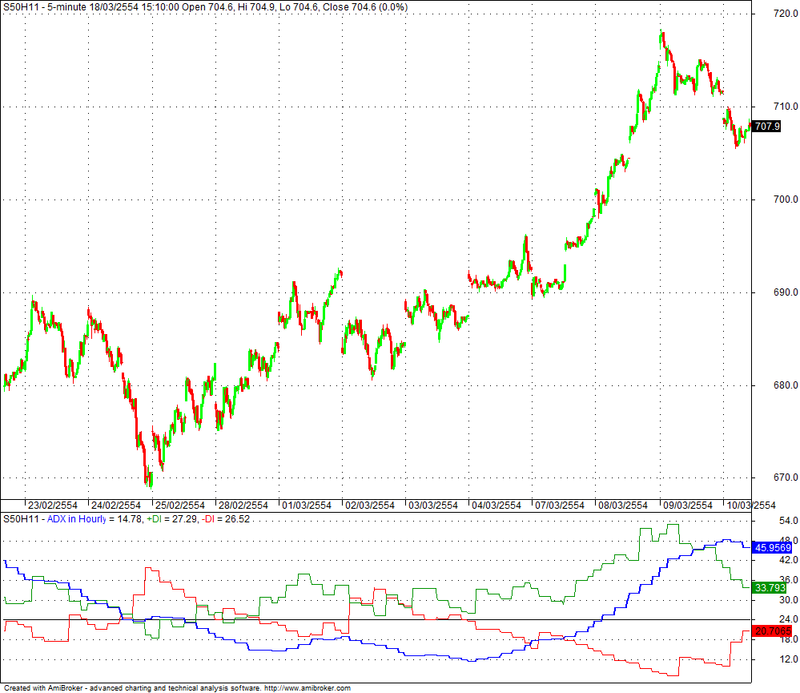
This indicator is seem like an original ADX indicator but more powerful with multiple time frame supports. So you can use this indicator with your specific time frame. Example ADX daily in 5 minute intraday chart.
Screenshots
Similar Indicators / Formulas
DTOscillator 2TF 5M-15M
Submitted
by hemsvg over 13 years ago
DAILY WEEKLY MACD
Submitted
by prasadbrao over 11 years ago
Color Price Bar - Impulse System
Submitted
by kaiji about 14 years ago
Weekly EMA on Daily Chart
Submitted
by rohann almost 10 years ago
Indicator / Formula
Copy & Paste Friendly
_SECTION_BEGIN("ADX with multiple Timeframe");
range = Param("Periods", 14, 2, 200, 1 );
p = ParamList("Timeframe", "5 Minute|15 Minute|Hourly|Daily|Weekly|Monthly", 3);
switch (p) {
	case "5 Minute": tf = in5Minute; break;
	case "15 Minute": tf = in15Minute; break;
	case "Hourly": tf = inHourly; break;
	case "Daily": tf = inDaily; break;
	case "Weekly": tf = inWeekly; break;
	case "Monthly": tf = inMonthly; break;
	default: tf = inDaily; break;
}

TimeFrameSet(tf);
adxVal = ADX(range);
pdiVal = PDI(range);
mdiVal = MDI(range);
TimeFrameRestore();

Plot(TimeFrameExpand(adxVal, tf), "ADX in " + p, ParamColor( "ADX color", colorBlue ), ParamStyle("ADX style", styleThick ) );
Plot(TimeFrameExpand(pdiVal, tf), "+DI", ParamColor( "+DI color", colorGreen ), ParamStyle("+DI style") );
Plot(TimeFrameExpand(mdiVal, tf), "-DI", ParamColor( "-DI color", colorRed ), ParamStyle("-DI style") );

Plot(Param("Signal Line", 24, 20, 30, 1), "", ParamColor("Signal Line color", colorBlack), ParamStyle("Signal Line style", styleLine|styleThick|styleNoLabel));
_SECTION_END();
0 comments
Leave Comment
Please login here to leave a comment.
Back