Stock Portfolio Organizer
The ultimate porfolio management solution.
Shares, Margin, CFD's, Futures and Forex
EOD and Realtime
Dividends and Trust Distributions
And Much More ....
WiseTrader Toolbox
#1 Selling Amibroker Plugin featuring:
Advanced Adaptive Indicators
Advanced Pattern Exploration
Neural Networks
And Much More ....
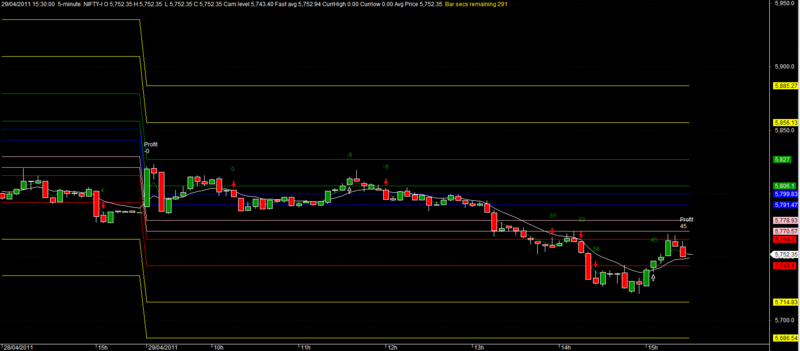
Camarilla Indicator for day trading for Amibroker (AFL)
Rating:
3 / 5 (Votes 2)
Tags:
amibroker, pivots
As compared to the previous code that I contributed, this is a version which has parameterized stop profit and re-entry signals. This is designed for using with the Indian Nifty data as the parameters will change for other stocks. Also this is best used with 5 minute intraday charts, though you can experiment with 7,12 and longer duration charts as well.
Screenshots
Similar Indicators / Formulas
Pivots and prices
Submitted
by kaiji over 14 years ago
Pivots And Prices And Swing Volume
Submitted
by esnataraj almost 14 years ago
Camarilla Pivots
Submitted
by novicetraders almost 14 years ago
Pivot Trading All-In-One
Submitted
by kirthi1987 about 14 years ago
Daily, Weekly and Monthly Pivots
Submitted
by sam_u6 about 14 years ago
Indicator / Formula
Copy & Paste Friendly
_SECTION_BEGIN("Draw Camarilla Levels");
SetChartOptions(0,chartShowArrows|chartShowDates);
showcamarella=ParamList("Show Camarella Lines","YES|NO");
showcandlechart=ParamList("Show Candle chart","YES|NO");
showwhat=IIf(ParamList("Todays or Tomorrows Levels","Today|Tomorrow")=="Tomorrow",1,-1);

if (showcandlechart=="YES")
{
	Plot( C, "Close", ParamColor("Color", colorWhite ), styleNoTitle | ParamStyle("Style") | GetPriceStyle() );
}
EMA10=EMA(C,10);
EMA3=EMA(C,3);
Plot(EMA10,"EMA10", colorWhite,styleLine|styleNoLabel);
Plot(EMA3,"EMA3", colorGreen,styleLine|styleNoLabel);

XH = TimeFrameGetPrice( "H", inDaily,showwhat);
XL = TimeFrameGetPrice( "L", inDaily,showwhat);
XC = TimeFrameGetPrice( "C", inDaily, showwhat );


r2=(((xh-xl)*1.1)/2)+xc;
r1=(((xh-xl)*1.1)/4)+xc;
s1=(xc-((xh-xl)*1.1)/4);
s2=(xc-((xh-xl)*1.1)/2);
n3=1;
tgt1=(1+.005*n3)*r2;
tgt2=(1+.01*n3)*r2;
tgt3=s2/(1+.005*n3);
tgt4=s2/(1+.01*n3);


if (showcamarella=="YES")
{
Plot(r1,"R1",colorGreen,styleLine|styleNoTitle);
Plot(r2,"R2",colorGreen,styleLine|styleNoTitle);
Plot(s1,"S1",colorRed,styleLine|styleNoTitle);
Plot(s2,"S2",colorRed,styleLine|styleNoTitle);
Plot(tgt1,"tgt1",colorYellow,styleLine|styleNoTitle);
Plot(tgt2,"tgt2",colorYellow,styleLine|styleNoTitle);
Plot(tgt3,"tgt3",colorYellow,styleLine|styleNoTitle);
Plot(tgt4,"tgt4",colorYellow,styleLine|styleNoTitle);
Plot(s1+(0.85*(r1-s1)),"int long target 2",colorBlue,styleLine|styleNoTitle);
Plot(s1+(0.65*(r1-s1)),"int long target 1",colorBlue,styleLine|styleNoTitle);
Plot(s1+(0.35*(r1-s1)),"int short target 1",colorPink,styleLine|styleNoTitle);
Plot(s1+(0.15*(r1-s1)),"int short target 2",colorPink,styleLine|styleNoTitle);
Buy=Cross(C,s1) OR Cross(C,r1) OR Cross(C,r2);
Sell=Cross(r1,C) OR Cross(s1,C) OR Cross(s2,C);
//parameters
gapavg=Param("Gap between Averages",8,0,20,.1);
gapcam=Param("Gap between Cam lines and fast avg",3.8,0,20,.1);
SP=Param("Stop Profit",23,0,25,.1);

Camlevel=IIf(abs(EMA3-r1)<abs(EMA3-r2),r1,r2);
Camlevel=IIf(abs(EMA3-s1)<abs(EMA3-r1),s1,Camlevel);
Camlevel=IIf(abs(EMA3-s2)<abs(EMA3-s1),s2,Camlevel);
Cvp=(O+C)/2;

Datex=DateNum();
//whipsaw removal
Buysignal=Sellsignal=lastbuy=lastsell=priceatbuy=priceatsell=slow=shigh=exitbuy=exitsell=curri=priceatexitbuy=priceatexitsell=0;
Lastexitsell=Lastexitbuy=profit=lastprofit=0;
for (i=1;i<BarCount-1;i++)
{
//change of day initialise variables
	if(Datex[i]!=Datex[i-1])
	{
		if (lastbuy==1)Lastprofit=profit[i-1]+Cvp[i-1]-priceatbuy;
		else if (Lastsell==1)Lastprofit=profit[i-1]+priceatsell-Cvp[i-1];
		else Lastprofit=profit[i-1];
		PlotText("Profit\n"+WriteVal(Lastprofit,1.0),i,H[i]+15,colorWhite);
		Buysignal=Sellsignal=lastbuy=lastsell=priceatbuy=priceatsell=curri=lastexitsell=lastexitbuy=0;
		profit[i]=0;

	}
	if(i==BarCount-2)
	{
		if (lastbuy==1)Lastprofit=profit[i]+Cvp[i]-priceatbuy;
		else if (Lastsell==1)Lastprofit=profit[i]+priceatsell-Cvp[i];
		else Lastprofit=profit[i-1];
		PlotText("Profit\n"+WriteVal(Lastprofit,1.0),i,H[i]+15,colorWhite);
	}


	if (Datex[i]==Datex[i-1])
	{
		shigh[i]=shigh[i-1];
		slow[i]=slow[i-1];
		profit[i]=profit[i-1];
	}
	if (H[i]>shigh[i])shigh[i]=H[i];
	if (L[i]<slow[i])slow[i]=L[i];
	if (Buy[i])
	{
		Buy[i]=0;
		Buysignal=1;
		Sellsignal=0;
	}
	if (Sell[i])
	{
		Sell[i]=0;
		Sellsignal=1;
		Buysignal=0;
	}
//	PlotText(WriteVal(profit[i],1.0),i,H[i]+5,colorWhite);
	if (Buysignal==1 AND ((EMA3[i]-EMA10[i]>gapavg) OR (EMA3[i]>EMA10[i])) AND EMA3[i]-Camlevel[i]>gapcam AND O[i]<C[i] )
	{
		if (lastbuy==1)profit[i]=profit[i]+Cvp[i]-priceatbuy;
		if (Lastsell==1)profit[i]=profit[i]+priceatsell-Cvp[i];
		Lastbuy=Lastsell=lastexitbuy=lastexitsell=0;
		Buysignal=0;
		Buy[i]=1;
		Lastbuy=1;
		priceatbuy=Cvp[i];
		slow[i]=L[i];
		shigh[i]=H[i];
		Curri=i;
	}
	if (SellSignal==1 AND ((EMA10[i]-EMA3[i]>gapavg) OR (EMA10[i]>EMA3[i])) AND Camlevel[i]-EMA3[i]>gapcam AND O[i]>C[i])
	{
		if (lastbuy==1)profit[i]=profit[i]+Cvp[i]-priceatbuy;
		if (Lastsell==1)profit[i]=profit[i]+priceatsell-Cvp[i];
		Lastbuy=Lastsell=lastexitbuy=lastexitsell=0;
		Sellsignal=0;
		Sell[i]=1;
		Lastsell=1;
		priceatsell=Cvp[i];
		slow[i]=L[i];
		shigh[i]=H[i];
		Curri=i;
	}
	if ((Lastbuy==1 OR (lastexitbuy==1 AND cvp[i]-priceatexitbuy>4)) AND shigh[i]-Cvp[i]>sp AND !Sell[i] AND i>Curri)
	{
		profit[i]=profit[i]+Cvp[i]-priceatbuy;
		exitbuy[i]=1;
		Lastexitbuy=1;
		Lastbuy=0;
		slow[i]=L[i];
		shigh[i]=H[i];
		priceatexitbuy=Cvp[i];
		Curri=i;
	}
	if ((Lastsell==1 OR (Lastexitsell==1 AND priceatexitsell-Cvp[i]>4)) AND Cvp[i]-slow[i]>sp AND !Buy[i] AND i>Curri)
	{
		profit[i]=profit[i]+priceatsell-Cvp[i];
		exitsell[i]=1;
		Lastexitsell=1;
		Lastsell=0;
		slow[i]=L[i];
		shigh[i]=H[i];
		priceatexitsell=Cvp[i];
		Curri=i;
	}
	if (i>Curri AND Lastexitsell==1 AND priceatexitsell-Cvp[i]>4)
	{
		Sellsignal=1;
		Lastexitsell=0;
	}
	if (i>Curri AND Lastexitbuy==1 AND Cvp[i]-priceatexitbuy>4)
	{
		buySignal=1;
		Lastexitbuy=0;
	}

	if (Buy[i] OR Sell[i] OR exitbuy[i] OR exitsell[i])
	{
	PlotText(WriteVal(Profit[i],1.0),i,H[i]+15,colorGreen);
	}


}


shape = Buy * shapeUpArrow + Sell * shapeDownArrow;
PlotShapes( shape, IIf( Buy, colorLime, colorRed ), 0, IIf( Buy, Low, High));
shape2 = exitsell *shapeHollowUpArrow + exitbuy *shapeHollowDownArrow;
PlotShapes( shape2, IIf( exitsell, colorWhite, colorWhite ), 0, IIf( exitsell, Low, High));


}

function GetSecondNum()
{
    Time 		= Now( 4 );
    Seconds 	= int( Time % 100 );
    Minutes 	= int( Time / 100 % 100 );
    Hours 	= int( Time / 10000 % 100 );
    SecondNum = int( Hours * 60 * 60 + Minutes * 60 + Seconds );
    return SecondNum;
}


RequestTimedRefresh( 1 );
TimeFrame = Interval();
SecNumber = GetSecondNum();
Newperiod = SecNumber % TimeFrame == 0;
SecsLeft	 = SecNumber - int( SecNumber / TimeFrame ) * TimeFrame;
SecsToGo	 = TimeFrame - SecsLeft;


Title = Date()+"  "+ Interval(format=2)+"  "+Name()+" O "+WriteVal(O,1.2)+" H "+WriteVal(H,1.2)+"  L "+WriteVal(L,1.2)+" C "+WriteVal(C,1.2)+" Cam level " + WriteVal(Camlevel,1.2)+" Fast avg "+WriteVal(EMA3,1.2)+" CurrHigh "+WriteVal(shigh,1.2)+" Currlow "+WriteVal(slow,1.2)+" Avg Price "+WriteVal(Cvp,1.2)+" "+ EncodeColor(colorYellow)+ " Bar secs remaining "+WriteVal(secstogo,1.0);
0 comments
Leave Comment
Please login here to leave a comment.
Back