Stock Portfolio Organizer
The ultimate porfolio management solution.
Shares, Margin, CFD's, Futures and Forex
EOD and Realtime
Dividends and Trust Distributions
And Much More ....
WiseTrader Toolbox
#1 Selling Amibroker Plugin featuring:
Advanced Adaptive Indicators
Advanced Pattern Exploration
Neural Networks
And Much More ....
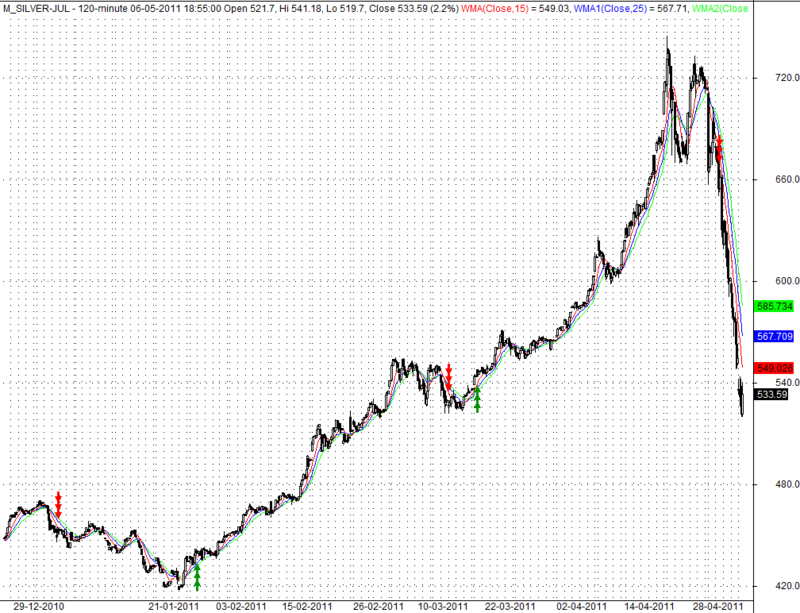
Weighted MA Crossover for Amibroker (AFL)
Rating:
5 / 5 (Votes 1)
Tags:
trading system, amibroker
Weighted MA Crossover indicator best suited for low risk traders. It gives very good result for swing trading.
enjoy!!!!!!!!!!!!!
Screenshots
Similar Indicators / Formulas
All in One
Submitted
by Nahid over 13 years ago
Kase Peak Osc. V2 batu
Submitted
by batu1453 almost 10 years ago
Kase CD V2batu
Submitted
by batu1453 almost 10 years ago
Ichimoku
Submitted
by prashantrdx almost 10 years ago
Arvind' System
Submitted
by akdabc almost 14 years ago
Miftha remix for dse
Submitted
by coolpace over 13 years ago
Indicator / Formula
Copy & Paste Friendly
_SECTION_BEGIN("Price");
SetChartOptions(0,chartShowArrows|chartShowDates);
_N(Title = StrFormat("{{NAME}} - {{INTERVAL}} {{DATE}} Open %g, Hi %g, Lo %g, Close %g (%.1f%%) {{VALUES}}", O, H, L, C, SelectedValue( ROC( C, 1 ) ) ));
Plot( C, "Close", ParamColor("Color", colorBlack ), styleNoTitle | ParamStyle("Style") | GetPriceStyle() );
_SECTION_END();

_SECTION_BEGIN("WMA");
P = ParamField("Price field",-1);
Periods = Param("Periods", 15, 2, 300, 1, 10 );
Plot( WMA( P, Periods ), _DEFAULT_NAME(), ParamColor( "Color", colorCycle ), ParamStyle("Style") );
_SECTION_END();

_SECTION_BEGIN("WMA1");
P = ParamField("Price field",-1);
Periods = Param("Periods", 15, 2, 300, 1, 10 );
Plot( WMA( P, Periods ), _DEFAULT_NAME(), ParamColor( "Color", colorCycle ), ParamStyle("Style") );
_SECTION_END();

_SECTION_BEGIN("WMA2");
P = ParamField("Price field",-1);
Periods = Param("Periods", 15, 2, 300, 1, 10 );
Plot( WMA( P, Periods ), _DEFAULT_NAME(), ParamColor( "Color", colorCycle ), ParamStyle("Style") );
_SECTION_END();


P = ParamField("Price field",-1);

Buy = (EMA( P , 25) > EMA ( P , 35)) AND (EMA( P , 35) > EMA ( P , 45)) AND (EMA( P , 25)>EMA ( P , 45));
Short = (EMA( P , 25) < EMA ( P , 35)) AND (EMA( P , 35) < EMA ( P , 45)) AND (EMA( P , 25)<EMA ( P , 45));

Buy = ExRem( Buy, Short);
Short = ExRem (Short, Buy);
PlotShapes(IIf(Buy, shapeUpArrow , shapeNone), colorGreen);
PlotShapes(IIf(Short, shapeDownArrow , shapeNone), colorRed);
4 comments
Leave Comment
Please login here to leave a comment.
Back
Hi,
Thanks for the AFL code.
Please suggest the time frame for which it is to be applied.
Best Regards,
SKFC
Hi,
You can insert the formula the option to optimize and backtest?
huges
Interesting. The chart and the buy/sell condition do not have any relationship.
Signals plotted on ema