Stock Portfolio Organizer
The ultimate porfolio management solution.
Shares, Margin, CFD's, Futures and Forex
EOD and Realtime
Dividends and Trust Distributions
And Much More ....
WiseTrader Toolbox
#1 Selling Amibroker Plugin featuring:
Advanced Adaptive Indicators
Advanced Pattern Exploration
Neural Networks
And Much More ....
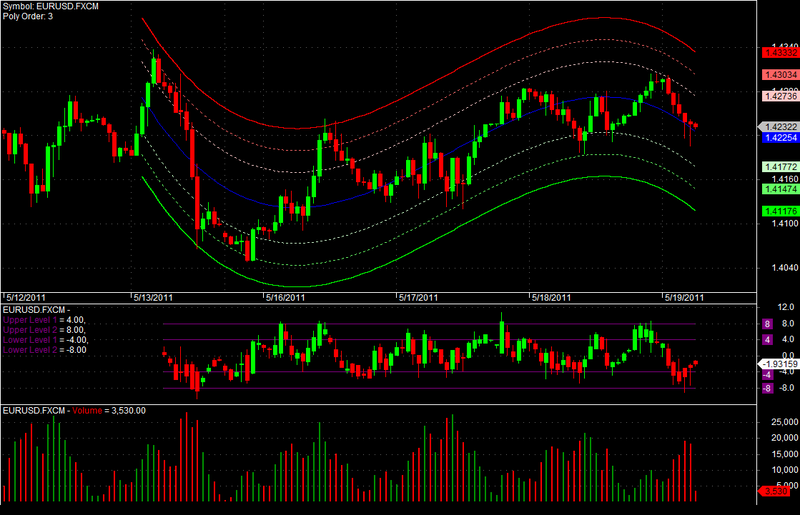
CENTER OF GRAVITY TIMING Indicator for Amibroker (AFL)
Rating:
4 / 5 (Votes 3)
Tags:
oscillator, amibroker, cog
COG timing indicator
AFL translation by E.M.Pottasch, 2011
from: http://chartstudio.whselfinvest.com/files/COGTiming.ctl
Screenshots
Similar Indicators / Formulas
Effort index
Submitted
by habib20216 over 10 years ago
Trading Volume Statistic
Submitted
by tuanstock1 almost 10 years ago
Ergodic Oscillator
Submitted
by dljtrader over 13 years ago
3 Days Track
Submitted
by janet0211 almost 14 years ago
Chande Momentum Oscillator
Submitted
by klimpek over 13 years ago
BoH Risk Aversion Indicator
Submitted
by genkumag over 12 years ago
Indicator / Formula
Copy & Paste Friendly
// COG timing indicator
// AFL translation by E.M.Pottasch, 2011
// from: http://chartstudio.whselfinvest.com/files/COGTiming.ctl

bi=BarIndex();
eb=LastValue(bi);
period=Param("Period",5,1,10,1);
bars=Param("Lookback Period",100,50,500,1);
sv=ParamToggle("Use Selected Value","Off|On",1);
level1=4;
level2=8;
ul1=ul2=ll1=ll2=Null;
oo=hh=ll=cc=Null;

if (sv)
{
	eb=SelectedValue(bi);
	bb=Max(0,eb-bars);
}
else
{
	bb=Max(0,eb-bars);
}
for(i=bb+period-1;i<=eb;i++)
{
	ul1[i]=level1;
	ul2[i]=level2;
	ll1[i]=-level1;
	ll2[i]=-level2;
	am=0;
	ar=0;
	for(j=i-period+1;j<=i;j++)
	{
		am=am+(High[j]+Low[j])/2;
		ar=ar+(High[j]-Low[j])/5;
	}
	am=am/period;
	ar=ar/period;
	if(ar!=0)
	{
		oo[i]=(Open[i]-am)/ar;
		hh[i]=(High[i]-am)/ar;
		ll[i]=(Low[i]-am)/ar;
		cc[i]=(Close[i]-am)/ar;
	}
	else
	{
		oo[i]=0;
		hh[i]=0;
		ll[i]=0;
		cc[i]=0;
	}
}
C=cc;O=oo;H=hh;L=ll;
Plot(C,"",colorWhite,styleCandle);
//PlotOHLC(O,H,L,C,"",colorWhite,styleCandle);
//Plot(cc,"Close",colorWhite,styleThick);
//Plot(oo,"\nOpen",colorLightGrey,styleLine);
//Plot(hh,"\nHigh",colorRed,styleLine);
//Plot(ll,"\nLow",colorRed,styleLine);
Plot(ul1,"\nUpper Level 1",colorViolet,styleLine);
Plot(ul2,"\nUpper Level 2",colorViolet,styleLine);
Plot(ll1,"\nLower Level 1",colorViolet,styleLine);
Plot(ll2,"\nLower Level 2",colorViolet,styleLine);
0 comments
Leave Comment
Please login here to leave a comment.
Back