Stock Portfolio Organizer
The ultimate porfolio management solution.
Shares, Margin, CFD's, Futures and Forex
EOD and Realtime
Dividends and Trust Distributions
And Much More ....
WiseTrader Toolbox
#1 Selling Amibroker Plugin featuring:
Advanced Adaptive Indicators
Advanced Pattern Exploration
Neural Networks
And Much More ....
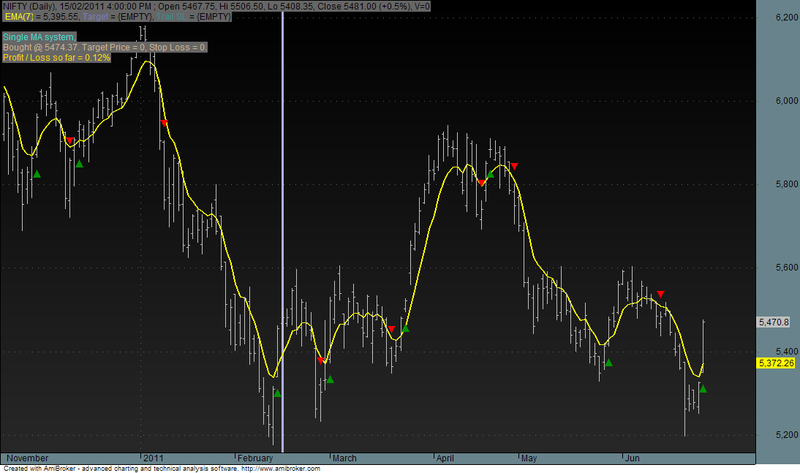
Amazing Buy Sell Signal for Amibroker (AFL)
Rating:
3 / 5 (Votes 5)
Tags:
trading system, amibroker, exploration
I have not written these codes, I got it from a website in non working condition & debug the formula. User can choose different types of charts and moving averages in this indicator & can customize according to his needs.
Screenshots
Similar Indicators / Formulas
OPTIMIZED ICHIMOKU
Submitted
by ritesh.bafna88 over 12 years ago
Reaction Trend System
Submitted
by ajayjain90 about 15 years ago
Behgozin Strength Finder
Submitted
by hotaro3 over 12 years ago
KPL with RSI
Submitted
by pdkg_gal about 15 years ago
Intraday Trend Break System
Submitted
by nishantndk about 15 years ago
ema crossovers
Submitted
by rushee.g1100 almost 15 years ago
Indicator / Formula
Copy & Paste Friendly
1 2 3 4 5 6 7 8 9 10 11 12 13 14 15 16 17 18 19 20 21 22 23 24 25 26 27 28 29 30 31 32 33 34 35 36 37 38 39 40 41 42 43 44 45 46 47 48 49 50 51 52 53 54 55 56 57 58 59 60 61 62 63 64 65 66 67 68 69 70 71 72 73 74 75 76 77 78 79 80 81 82 83 84 85 86 87 88 89 90 91 92 93 94 95 96 97 98 99 100 101 102 103 104 105 106 107 108 109 110 111 112 113 114 115 116 117 118 119 120 121 122 123 124 125 126 127 128 129 130 131 132 | _SECTION_BEGIN("Background_Setting");SetChartBkGradientFill( ParamColor("BgTop", colorBlack),ParamColor("BgBottom", colorDarkGrey),ParamColor("TitleBack",colorGrey40)); SetChartBkColor(ParamColor("Outer Panel",colorPaleBlue));_SECTION_END();_SECTION_BEGIN("SingleMA");SetChartOptions(0, chartShowDates | chartWrapTitle);Type = ParamList("Average Type", "Wilders,SMA,EMA");P = Param("Averaging Period", 20, 3, 100,1);Q = Param("%Change", 1, 0.1, 10, 0.1);BP = Param("BB Period", 20, 3, 100);BW = Param("BB Width", 2, 0.5, 10, 0.5);BBOption = ParamToggle("Plot BB", "No I Yes");Report = ParamList("Trigs or Update or Tgt-SL?", "Triggers|Update|Tgt-SL");if(Type == "Wilders") A = Wilders(C, P);if(Type == "SMA") A = MA(C, P);if(Type == "EMA") A = EMA(C, P);SL = Max(LLV(L, 5), Trough(L, Q, 1));Tgt = 2 * H - SL;MeanPrice = Prec((O + C) / 2, 2);Part = 100 * (H - A) / (H - L);BBTop = BBandTop(C, BP, BW);BBBot = BBandBot(C, BP, BW);Buy = (Prec(C, 2) > Prec(A, 2)) AND Part > 70;Sell = H < A;Buy = ExRem(Buy, Sell);Sell = ExRem(Sell, Buy);Bought = Flip(Buy, Sell);Sold = Flip(Sell, Buy);NextTgt = ValueWhen(Buy, Tgt, 1);for(i = 1; i < BarCount; i++) { "if(Bought AND NOT Buy)"; { SL = Max(SL, SL[i - 1]); if(C[i - 1] >= 0.9999 * NextTgt[i - 1]) NextTgt = Tgt[i - 1]; NextTgt = Max(NextTgt, NextTgt[i - 1]); } }BuyDate = ValueWhen(Buy, Ref(DateTime(), 1), 1);BuyPrice = ValueWhen(Buy, Ref(MeanPrice, 1), 1);SellPrice = ValueWhen(Sell, Ref(MeanPrice, 1), 1);TgtReached = IIf(Bought AND NOT Buy AND C >= 0.9999 * NextTgt, True, False);SLHit = IIf(Bought AND NOT Buy AND C < SL, True, False);SLHit = ExRem(SLHit, Buy);//if(TgtReached[BarCount - 1]) NextTgt[BarCount - 1] = 2 * H[BarCount -1] - SL[BarCount - 1];//if(Status("action") == actionIndicator) { Ttl = EncodeColor(colorTurquoise) + "Single MA system," + "\n" + WriteIf(Buy, EncodeColor(colorGreen) + "Buy Triggered Today, Buy this stock Tomorrow.","") + WriteIf(Sell, EncodeColor(colorRed) + "Sell Triggered Today, Sell This stock Tomorrow.", "") + EncodeColor(colorTan) + WriteIf(Bought AND NOT Buy, "Bought @ " + BuyPrice + ". " + "Target Price = " + NextTgt + ", Stop Loss = " + SL + ".\n" + WriteIf(TgtReached, "Target Reached. Next Target = " + Ref(NextTgt, 1) + ".\n", "") + EncodeColor(colorGold) + "Profit / Loss so far = " + Prec(100 * (C - BuyPrice) / BuyPrice, 2) + "%", "") + WriteIf(Sold AND NOT Sell, "Sold @ " + SellPrice + "\nProfit / Loss in Previous Trade = " + Prec(100 * (SellPrice - BuyPrice) / BuyPrice, 2) + "%", ""); _N(Title = StrFormat("{{NAME}} ({{INTERVAL}}), {{DATE}} ; {{OHLCX}}, V=%1.0f\n {{VALUES}}\n\n", V) + Ttl); ChartStyle = ParamStyle("Chart Type", styleBar, maskAll); PlotOHLC(O, H, L, C, "", colorLightGrey, ChartStyle); Plot(A, Type + "(" + P +")", colorYellow, styleLine | styleThick); Plot(IIf(Bought, NextTgt, Null), "Target", colorBlueGrey, styleLine); Plot(SL, "Trail SL", colorTeal, styleLine); //PlotShapes(IIf(Buy, shapeSquare, shapeNone),colorGreen, 0, L, Offset=-20); //PlotShapes(IIf(Buy, shapeSquare, shapeNone),colorLime, 0,L, Offset=-30); PlotShapes(IIf(Buy, shapeSmallUpTriangle, shapeNone),colorGreen, 0,L, Offset=-25); //PlotShapes(IIf(Sell, shapeSquare, shapeNone),colorRed, 0, H, Offset=20); //PlotShapes(IIf(Sell, shapeSquare, shapeNone),colorOrange, 0,H, Offset=30); PlotShapes(IIf(Sell, shapeSmallDownTriangle, shapeNone),colorRed, 0,H, Offset=-25); if(BBOption) Plot(BBtop, "BB-Top", colorPink, styleLine); if(BBOption) Plot(BBBot, "BB-Bot", colorPink, styleLine); }if((Status("action") == actionExplore) AND Report == "Triggers") { Filter = Buy OR Sell; SetOption("NoDefaultColumns", True); AddTextColumn(Name(), "Symbol", 77, colorDefault, colorDefault, 120); AddColumn(DateTime(), "Trigger Date", formatDateTime); AddColumn(IIf(Buy, 66, 83), "Signal", formatChar, colorYellow, IIf(Buy, colorGreen, colorRed)); AddColumn(C, "C. M. P.", 6.2); AddColumn(IIf(Buy OR Bought, NextTgt, Null), "Target", 6.2); AddColumn(IIf(Buy OR Bought, SL, Null), "StopLoss", 6.2); }if((Status("action") == actionExplore) AND Report == "Update") { Filter = True; SetOption("NoDefaultColumns", True); AddColumn(DateTime(), "Updated On", formatDateTime, colorDefault, colorDefault, 96); AddTextColumn(Name(), "Symbol", 77, colorDefault, colorDefault, 120); AddColumn(BuyDate, "Buy Date", formatDateTime, colorDefault, colorDefault, 96); AddColumn(BuyPrice, "Buy Price", 6.2); AddColumn(NextTgt, "Target", 6.2); AddColumn(SL, "StopLoss", 6.2); AddColumn(C, "CMP", 6.2, colorDefault, colorDefault, 96); }if((Status("action") == actionExplore) AND Report == "Tgt-SL") { Filter = TgtReached OR SLHit; SetOption("NoDefaultColumns", True); AddColumn(DateTime(), "Updated On", formatDateTime, colorDefault, colorDefault, 96); AddTextColumn(Name(), "Symbol", 77, colorDefault, colorDefault, 120); AddColumn(BuyDate, "Buy Date", formatDateTime, colorDefault, colorDefault, 96); AddColumn(BuyPrice, "Buy Price", 6.2); AddColumn(NextTgt, "Target", 6.2); AddColumn(SL, "StopLoss", 6.2); AddColumn(C, "CMP", 6.2, colorDefault, colorDefault, 96); AddColumn(IIf(TgtReached, 89, 32), "Tgt Hit?", formatChar, colorYellow, IIf(TgtReached, colorGreen, colorDefault)); AddColumn(IIf(TgtReached, 2 * H - SL, Null), "Next Tgt", 1.2); AddColumn(IIf(SLHit, 89, 32), "SL-Hit", formatChar, colorYellow, IIf(SLHit, colorRed, colorDefault)); } |
2 comments
Leave Comment
Please login here to leave a comment.
Back
Thanks Rakesh for posting this AFL.
I will backtest & post results of this AFL ASAP.
looks like HULL.. If its Hull, its useless.. Signals appear delayed after few candles.