Stenitz System for Amibroker (AFL)
vishyvishy over 16 years ago Amibroker (AFL)
Looks promising than Standard Heikin Ashi…
use it with “Heinkein 4T – KR” indicator
Entry Rules
Going Long
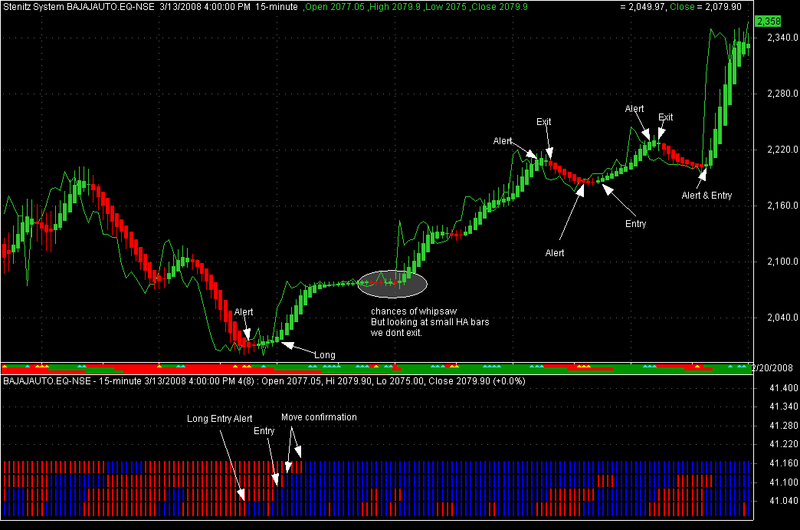
When the lowest TF (For example 15 min) bar turns from red to blue we are alert of an impending reversal. When the bar of the next higher time frame changes from red blue we get a confirmation of the trend change. This is the time to enter. If the still higher TF bar changes from red to blue we get the confirmation the current move is strong. If the highest TF bar also changes from red to blue we are in a strong move.
Exit
When the lowest time frame color change from blue to red we are alerted that that current move may end. Confirmation come in terms of the next higher TF bar also changes from blue to red. Then we exit the trade.
There is also a riskier approach. When all the four TF are blue (meaning the move is strong) and the reversal occurs we wait till three lower TFs to change color blue to red. Here the peak drawdown could be huge.
Going short and exits
The exact conditions mentioned above for long but the color change from blue to red.
Note:
Also note the HA bars themselves give many clues to the state of the move. long bars with long shadows indicate strength. Small bars with small shadows indicate weak moves.
Screenshots
Indicator / Formula
_SECTION_BEGIN("Stenitz System");

SetChartOptions(0,chartShowArrows|chartShowDates);
Title = ("Stenitz System " + Name()+"  " + Date() +"  "+Interval(2) +"  "+ EncodeColor(colorLime)+",Open "+Open +" ,High "+H+" ,Low "+L+" ,Close "+C+" "+"{{VALUES}}");

per1=Param("First Period",6,2,30,1);
per2=Param("Second Period",2,2,30,1);
Om=MA(O,per1);
hm=MA(H,per1);
lm=MA(L,per1);
Cm=MA(C,per1);


//==============================================================================================================
HACLOSE=(Om+Hm+Lm+Cm)/4;
HaOpen = AMA( Ref( HaClose,  -1 ),  0.5 );
HaHigh = Max( Hm,  Max( HaClose,  HaOpen ) );
HaLow = Min( Lm,  Min( HaClose,  HaOpen ) );
//PlotOHLC( HaOpen, HaHigh, HaLow, HaClose, "" + Name(), colorBlack, styleCandle | styleNoLabel );

Of=MA(Haopen,per2);
Cf=MA(Haclose,per2);
Lf=IIf(haOpen<haClose,MA(Halow,per2),MA(Hahigh,per2));
Hf=IIf(haOpen<haClose,MA(Hahigh,per2),MA(Halow,per2));

PlotOHLC( Of, Hf, Lf, Cf, "" + Name(), colorBlack, styleCandle | styleNoLabel );


Plot(C,"Close",colorLime,styleLine);
//=======================================================================================================================
13 comments
Leave Comment
Please login here to leave a comment.
Good contribution vishyvishy looks very interesting.
Very good indicator for intraday and delivery
You can simply make millions with this system. The best system i have ever seen for both intraday and eod.
I can only see the candles. Don’t see the comments and arrows.
Dear,
Admin,Vishyvishy, Freinds,
Which afl is shown at the bottom ? I mean the name of the afl please.
Regards,
CNBONDRE
the indicator seems to be incomplete , its not what it looks like in the picture , probably its been cut off after the 32nd line
how to get the bottom blue red lines displayed?
HI,
FRIENDS,
The bottom picture is
“Heinkein 4T – KR” indicator
It is available here,in our library.
http://www.wisestocktrader.com/indicators/217-heinkein-4t-kr
http://www.wisestocktrader.com/indicators/217-heinkein-4t-kr.txt
cnbondre
which is the indicator that u have shown in the middle of the picture.
One of the best Contribution….. great job……i liked it very much. Thnx again.
ITS TOTALLY DIFFERENT FROM SHOWN ABOVE PICTURE
PLEASE UPDATE WHICH YOU SHOWN IN THE PICTURE, KINDLY UPDATE IN FORMULA TOO..
:-)
Thanks in advance
Sathish
hello fellow traders.. Elvis Presley Rocks :)
I took a peek at this Stenitz System & I must say I do not like these types of candle sticks.. they are lagging price. I prefer original candles as my puppy bear. No worries this system is highly useful after all in my trading… just the candles that is.
First swing over & compare this to the MACD… thats how I use, as the MACD. The candles start off narrow, expand wide then arrow.. doesn’t that remind you of the MACD converging to the signal line ? Elvis would say “Thank you very much”
The chart comes with some green line.. heck I didn’t know what that was, I figure a average but it doesn’t matter. I found for that to as a swing trader. I find it works very well as a leading indicator. As it pulls down to the candles, a dip is born & as it crosses below the candles we have a pull back.
I tell you that is one nice colorful system even though I use it as a indicator.. it’s very powerful at such.. The best momentum indicator I have every had the pleasure working with. I love the red & green colors, the tails on the candle.
The only problem I found with this was it didn’t tell me when price fell below & loss momentum, you know like the MACD would once it crossed below the zero line ? just plot a 50 day simple average.. works well, as price dips below just know the MACD would be below zero.
As a system by itself, I have no use for it but as a indicator I must say wow! what a piece of history to grab.
Thanks bunch,
Jerry apple
Sir, how to creat Exploration for Steniz System or Heinkein
Thank you so much