Stock Portfolio Organizer
The ultimate porfolio management solution.
Shares, Margin, CFD's, Futures and Forex
EOD and Realtime
Dividends and Trust Distributions
And Much More ....
WiseTrader Toolbox
#1 Selling Amibroker Plugin featuring:
Advanced Adaptive Indicators
Advanced Pattern Exploration
Neural Networks
And Much More ....
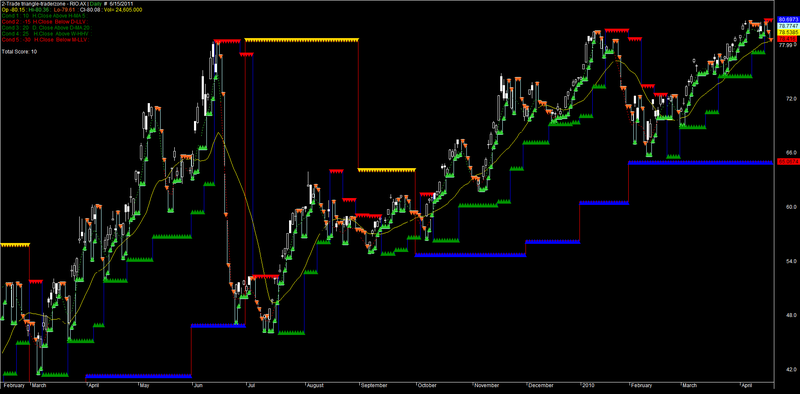
Triangle Trade Zone for Amibroker (AFL)
Rating:
4 / 5 (Votes 8)
Tags:
trading system, amibroker
Trade Triangle concept for intraday trading.
Screenshots
Similar Indicators / Formulas
All in One
Submitted
by Nahid over 13 years ago
Kase Peak Osc. V2 batu
Submitted
by batu1453 almost 10 years ago
Kase CD V2batu
Submitted
by batu1453 almost 10 years ago
Ichimoku
Submitted
by prashantrdx almost 10 years ago
Arvind' System
Submitted
by akdabc almost 14 years ago
Miftha remix for dse
Submitted
by coolpace over 13 years ago
Indicator / Formula
Copy & Paste Friendly
_SECTION_BEGIN("Price");

SetChartOptions(0,chartShowArrows|chartShowDates);
_N(Title = StrFormat("{{NAME}} - Open %g, Hi %g, Lo %g, Close %g (%.1f%%) {{VALUES}}", O, H, L, C, SelectedValue( ROC( C, 1 ) ) ));
_SECTION_END();

_SECTION_BEGIN("Trade triangle-traderzone");
TimeFrameSet(in15Minute);
HMAA = Param("H-MA1", 5, 2, 30, 1, 10 );
H2 = MA(C, HMAA );
Hc=C;
TimeFrameRestore();
Hp=TimeFrameExpand(H2,in15Minute,expandFirst);
hc=TimeFrameExpand(hc,in15Minute,expandFirst);
Plot(C,"",IIf(Hc>Hp,colorWhite,colorBlack),64);

TimeFrameSet(in15Minute);
DMAA = Param("D-MA",20, 2, 30, 1, 10 );
DP = MA(C, DMAA );
Dc=C;
TimeFrameRestore();
dp=TimeFrameExpand(DP,in15Minute,expandFirst);
dc=TimeFrameExpand(Dc,in15Minute,expandFirst);

Plot( Hp,"HMA",IIf(hp>dp,colorLime,colorRed),styleDashed);
Plot(dp ,"DMA",colorYellow,styleLine);

TimeFrameSet(in15Minute);
no=Param( "Triangle D", 3, 1, 55 ,1);
dres=HHV(H,no);
dsup=LLV(L,no);
davd=IIf(H>Ref(dres,-1),1,IIf(L<Ref(dsup,-1),-1,0));
davn=ValueWhen(davd!=0,davd,1);
dtsl=IIf(davn==1,dsup,dres);
dB=H>dtsl;
dS=L<dtsl;
TimeFrameRestore();
dtsl= TimeFrameExpand(dtsl,in15Minute,expandFirst);
db=TimeFrameExpand(dB,in15Minute,expandFirst);
ds=TimeFrameExpand(dS,in15Minute,expandFirst);


TimeFrameSet(inWeekly);
no=Param( "Triangle W", 3, 1, 55 ,1);
wres=HHV(H,no);
wsup=LLV(L,no);
wavd=IIf(H>Ref(wres,-1),1,IIf(L<Ref(wsup,-1),-1,0));
wavn=ValueWhen(wavd!=0,wavd,1);
wtsl=IIf(wavn==1,wsup,wres);
WB=H>WTSL;
WS=L<WTSL;
TimeFrameRestore();
wtsl=TimeFrameExpand(wtsl,inWeekly,expandFirst);
wb=TimeFrameExpand(WB,inWeekly,expandFirst);
ws=TimeFrameExpand(WS,inWeekly,expandFirst);


TimeFrameSet(inMonthly);
no=Param( "Triangle m", 3, 1, 55 ,1);
mres=HHV(H,no);
msup=LLV(L,no);
mavd=IIf(H>Ref(mres,-1),1,IIf(L<Ref(msup,-1),-1,0));
mavn=ValueWhen(mavd!=0,mavd,1);
mtsl=IIf(mavn==1,msup,mres);
MB=H>MTSL;//Cross(H,mtsl);
MS=L<MTSL;//Cross(mtsl,L);
TimeFrameRestore();
mtsl=TimeFrameExpand(mtsl,inMonthly,expandFirst);
mb=TimeFrameExpand(MB,inMonthly,expandFirst);
ms=TimeFrameExpand(MS,inMonthly,expandFirst);


CA=ParamToggle("Show Daily ","NO|YES" ,0);
CB=ParamToggle("Show Weekly","NO|YES" ,0);
CD=ParamToggle("Show Montly","NO|YES" ,0);
if(CA==1){
Plot(dtsl,"D",colorSkyblue,styleStaircase|styleNoRescale);
PlotShapes(db*shapeSmallUpTriangle,colorLime,0,dTSL,3);
PlotShapes(ds*shapeSmallDownTriangle,colorOrange,0,dTSL,3);
}if(CB==1){
Plot(wtsl ,"W",colorBlue,styleStaircase|styleNoRescale);
PlotShapes(wb*shapeSmallUpTriangle,colorGreen,0,wtsl,-2);
PlotShapes(ws*shapeSmallDownTriangle,colorRed,0,wtsl,-2);
}if(CD==1){
Plot(mtsl ,"M",colorRed,styleStaircase|styleNoRescale);
PlotShapes(mb*shapeSmallUpTriangle,colorBlue,0,mTSL,-5);
PlotShapes(ms*shapeSmallDownTriangle,colorGold,0,mTSL,-5);
}

_SECTION_END();


xt1=IIf( Hc > Hp, 10, -10 );//IIf( Hc > Hp, 10, -10 );
xt1_status= WriteIf(HC > Hp, "   H.Close Above H-MA 5 :   ",  "   H.Close Below H-MA 5 :    ");
xt1_Col=IIf(SelectedValue(xt1)>0, colorGreen, IIf(SelectedValue(xt1)<0, colorRed, colorLightGrey));
xt1_C=IIf(HC > Hp, colorGreen, IIf(HC < Hp, colorRed, colorLightGrey));


xt2=IIf(  BarsSince(db)< BarsSince(ds), 15, -15 );//1
xt2_status= WriteIf(DB > DS, "    H.Close Above D-HHV  :    ", WriteIf(DB < DS, "  H.Close  Below D-LLV :    ",""));
xt2_Col=IIf(SelectedValue(xt2)>0, colorGreen, IIf(SelectedValue(xt2)<0, colorRed, colorLightGrey));
xt2_C=IIf(db>ds, colorGreen, IIf(DB < DS, colorRed, colorLightGrey));

xt3=IIf( dc>dp, 20, -20 );
xt3_status= WriteIf(DC > DP, "   D. Close Above D-MA 20 :   ", WriteIf(DC < DP, "   D. Close Below D-MA 20 :    ",""));
xt3_Col=IIf(SelectedValue(xt3)>0, colorGreen, IIf(SelectedValue(xt3)<0, colorRed, colorLightGrey));
xt3_C=IIf(dc>dp, colorGreen, IIf(Dc < Dp, colorRed, colorLightGrey));

xt4=IIf( BarsSince(wb)< BarsSince(ws), 25, -25 ); //2
xt4_status= WriteIf(WB > WS, "    H.Close  Above W-HHV  :  ", WriteIf(WB < WS, "  H.Close  Below W-LLV :    ",""));
xt4_Col=IIf(SelectedValue(xt4)>0, colorGreen, IIf(SelectedValue(xt4)<0, colorRed, colorLightGrey));
xt4_C=IIf(WB > WS, colorGreen, IIf(WB < WS, colorRed, colorLightGrey));

xt5=IIf( BarsSince(mb)< BarsSince(ms),30, -30 );//3
xt5_status= WriteIf(MB > MS, "   H.Close  Above M-HHV  :   ", WriteIf(MB < MS, "   H.Close  Below M-LLV :   ",""));
xt5_Col=IIf(SelectedValue(xt5)>0, colorGreen, IIf(SelectedValue(xt5)<0, colorRed, colorLightGrey));
xt5_C=IIf(mB > mS, colorGreen, IIf(mB < mS, colorRed, colorLightGrey));
total=Sum((xt1+xt2+xt3+xt4+xt5),1);


Filter = (xt1 OR xt2 OR xt3 OR xt4 OR xt5 ) AND total ;
AddColumn(xt1, "5 MA", 1.0, colorWhite, xt1_C,-1);
AddColumn(xt2, "Daily", 1.0, colorWhite, xt2_C,-1);
AddColumn(xt3, "20 MA", 1.0, colorWhite, xt3_C,-1);
AddColumn(xt4, "Weekly", 1.0, colorWhite, xt4_C,-1);
AddColumn(xt5, "Monthly", 1.0, colorWhite, xt5_C,-1);
AddColumn(total, "Score", 1);


if( Status("action") == actionIndicator )
(
Title = EncodeColor(colorWhite)+ "2-Trade triangle-traderzone" + " - " +  Name() +
 " | " + EncodeColor(colorLime)+ Interval(2) + EncodeColor(colorWhite) + "  #  "+ Date()+
"\n"+EncodeColor(colorYellow) +"Op -"+O+" : "+EncodeColor(colorLime)+"Hi-"+H+" :  "+EncodeColor(colorOrange)+"Lo-"+L+"  : "+EncodeColor(colorWhite)+ "Cl-"+C+" : "+EncodeColor(colorYellow)+ "Vol= "+ WriteVal(V)+

EncodeColor(xt1_Col)+WriteIf(xt1,"\nCond 1 : "+xt1+"","")+xt1_status +
EncodeColor(xt2_Col)+WriteIf(xt2,"\nCond 2 : "+xt2+"","")+xt2_status +
EncodeColor(xt3_Col)+WriteIf(xt3,"\nCond 3 : "+xt3+"","")+xt3_status +
EncodeColor(xt4_Col)+WriteIf(xt4,"\nCond 4 : "+xt4+"","")+xt4_status +
EncodeColor(xt5_Col)+WriteIf(xt5,"\nCond 5 : "+xt5+"","")+xt5_status +
EncodeColor(2)+WriteIf(total,"\n\nTotal Score: "+total+"",""));

/*

if( Status("action") == actionCommentary )
(

printf ( "--------------------------\nTrade Trinagle" + ""));
WriteIf(C,"\n---------------------------","");
WriteIf(total==100,"+100 : Strong uptrend is in place AND this market will likely remain in a long-term positive direction..","")+
WriteIf(total==90,"+90 : Positive in long-term. Look for this market to remain firm. Strong Uptrend with money management stops.
A triangle indicates the presence of a very strong trend that is being driven by strong forces AND insiders.","")+
WriteIf(total==85,"+85 : An uptrend is in place. Intraday, intermediate AND long-term trends are pointing in a positive direction,
while the Short-term trend is in a downward direction..","")+
WriteIf(total==80,"+80 : An uptrend is in place. Although the intraday, daily, weekly AND monthly trends are all pointing in a positive direction,
the current market action has fallen below the 20 Day moving average..","")+
WriteIf(total==75,"+75 : The market may be in some near-term weakness. This market is still a long-term upward trend with intermediate
AND longer-term trends pointing to a bull market, but Short-term AND intraday term AND point to a bearish movement. Keep tight money management stops..","")+
WriteIf(total==70,"+70 : This market remains in the confines of a longer-term uptrend..","")+
WriteIf(total==65,"+65 : Although the long-term positive trends are strengthening, the intermediate-term could Signal the start of a major downtrend.
You may want to keep your money management stops tighter than you normally would.
You may also want to incorporate an alternative technical analysis Study
on your Short-term chart to confirm the “Trade Triangle” signals..","")+
WriteIf(total==60,"+60 : This upward trend may have lost momentum AND may be reaching a crossroads. You may see choppy market conditions in the near-term.
Trend for the intraday, Short-term, intermediate AND long-term are NOT aligning in a stable direction. This would be a time to move onto
the sidelines until a steady trend returns.","")+
WriteIf(total==55,"+55 : The trend of this market may be moving into a trading range. Trend for the intraday,
Short-term, intermediate-term AND long-term are NOT aligning in a stable direction.
This may be the time to move onto the sidelines until a steady trend returns.","")+
WriteIf(total==50  ,"+50 : The trend is at a crossroads, AND the momentum is faint if even there at all.
Look for near-term choppy trading conditions AND
consider taking a sidelines position until a steady trend returns.","")+
WriteIf(total< 50 AND total>-50  ,"Between +50/-50 : No Comments","")+
WriteIf(total==-50 ,"-50 : The trend is at a crossroads, AND the momentum is faint if even there at all.
Look for near-term choppy trading conditions AND
consider taking a sidelines position until a steady trend returns.","")+
WriteIf(total==-55,"-55 : The trend of this market may be moving into a trading range. Trend for the intraday,
Short-term intermediate-term an long-term are NOT aligning in a stable direction.
This would be the time to move onto the sidelines until a steady trend returns.","")+
WriteIf(total==-60,"-60 : The downward trend has lost momentum AND is reaching a crossroads. You may see choppy market conditions in the near-term.
Trend for the intraday, Short-term, intermediate-term AND long term are NOT aligning in a stable direction.
This would be a time to move onto the sidelines until a steady trend returns.","")+
WriteIf(total==-65,"-65 : Although the long-term negative trend is strengthening, the intermediate-term could Signal the start of a major uptrend.
You may want to keep your money management stops tighter than you normally would.","")+
WriteIf(total==-70,"-70 : This market may be experiencing some near-term strength. However, this market remains in the confines of a longer-term downtrend.","")+
WriteIf(total==-75,"-75 : This market may be looking at some near-term rallying power. This market is still in a long-term downward trend with
intermediate AND longer-term trends pointing lower, but Short-term AND intraday-term pointing to a bull market. Keep tight money management stops.","")+
WriteIf(total==-80,"-80 : A downtrend may be in place. Although the intraday, daily, weekly AND monthly trends are all pointing in a negative direction,
the market action has moved over the 20 Day moving average.","")+
WriteIf(total==-85,"-85 : A downtrend is in place. Intraday, intermediate AND long-term trends are pointing in a negative direction,
while the Short-term trend is in an upward direction.","")+
WriteIf(total==-90,"-90 : This score suggests that a weak downtrend is in place. This market is likely to continue
in a downward direction unless new weekly highs are made. Use proper money management stops as this market may change rapidly.","")+
WriteIf(total==-100,"-100 : A strong downtrend is in place AND this market will likely remain in a long-term negative direction.","");
*/
9 comments
Leave Comment
Please login here to leave a comment.
Back
Good Work.
Efficient and simple in 5 minutes chart.
Dear Administrator.
Pease enable all parameters in Trade Triangle AFL,so that all trend triangles will be displayed.
Dear sir good working but triangles not coming that yellow red and blue lines r not coming pl rectified.
Dear sir thanks for the formula but the red and blue lines are not comming in the chaRT,, and even the triangle, plz mail me the formula to ma80rao@yahoo.com
thank u
reagrds
rani
Excellent. Thanks Gopal.
Hello administrator
very good afl this is. Request the code writers please write code formula for scann with buy sell signals. this very good working and the result is very good in 5 min time frame. If anybody write afl candle above red line buy and above yellow again buy. Please i request the code writers write afl according this idea its very helpful to us.
formula is different, picture is different. The formula given is useless as it repaints the candles.
Thank’s for AFL’s Gopal. May I suggested to complete for use, wise if you addded each stage with rasio scoring. Stage may be included recovery, accumulation and distribution.
Good Luck.