Stock Portfolio Organizer
The ultimate porfolio management solution.
Shares, Margin, CFD's, Futures and Forex
EOD and Realtime
Dividends and Trust Distributions
And Much More ....
WiseTrader Toolbox
#1 Selling Amibroker Plugin featuring:
Advanced Adaptive Indicators
Advanced Pattern Exploration
Neural Networks
And Much More ....
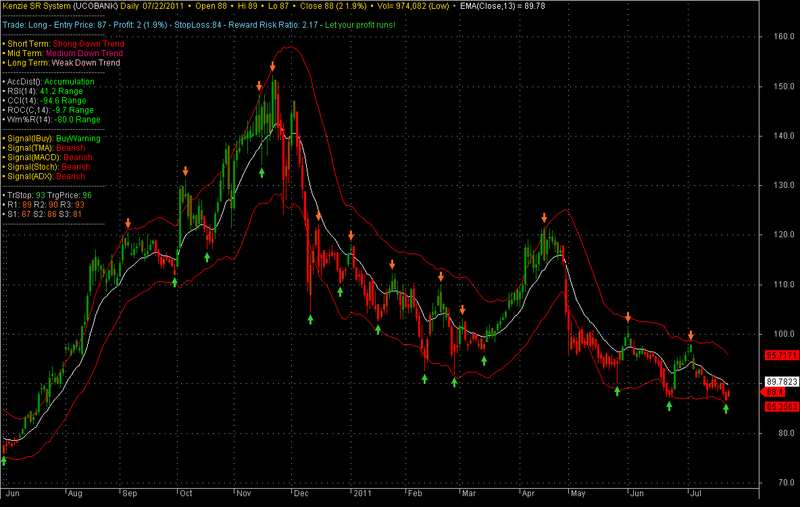
Kenzie SR System for Amibroker (AFL)
Rating:
4 / 5 (Votes 9)
Tags:
trading system, amibroker, pivot
Kenzie SR System
Screenshots
Similar Indicators / Formulas
koam-ashi nifty trading system
Submitted
by NILESH53333 about 15 years ago
T3 buy/sell update
Submitted
by bigyorum.com over 14 years ago
Fibonacci Linear Reg for Amibroker
Submitted
by anandnst almost 15 years ago
Night Star
Submitted
by ajeet almost 14 years ago
Basic Trading System
Submitted
by morgen almost 16 years ago
Heikin-Ashi, PAC
Submitted
by Mithun almost 16 years ago
Indicator / Formula
Copy & Paste Friendly
//------------------------------------------------------------------------------
//
//  Kenzie SR System - 09/2010
//  Modified By Kenzie Sebastian (kenziesr@yahoo.co.id)
//  Shared for milis amibroker-4-bei@yahoogroups.com
//
//------------------------------------------------------------------------------

SetBarsRequired(200,0);

GraphXSpace = 7;
SetChartOptions(0,chartShowArrows|chartShowDates);


//---------------Color------------------------
per1=6;
per2=2;
Om=MA(O,per1);
hm=MA(H,per1);
lm=MA(L,per1);
Cm=MA(C,per1);

HACLOSE=(Om+Hm+Lm+Cm)/4;
HaOpen = AMA( Ref( HaClose,  -1 ),  0.5 );
HaHigh = Max( Hm,  Max( HaClose,  HaOpen ) );
HaLow = Min( Lm,  Min( HaClose,  HaOpen ) );

Of=MA(Haopen,per2);
Cf=MA(Haclose,per2);
Lf=IIf(haOpen<haClose,MA(Halow,per2),MA(Hahigh,per2));
Hf=IIf(haOpen<haClose,MA(Hahigh,per2),MA(Halow,per2));
//Color = IIf( Cf > Of, colorGreen, colorRed );


//----------------------------------------------------


TrailStop = HHV( C - 2 * ATR(10), 15 );
ProfitTaker = EMA( H, 13 ) + 2 * ATR(10);


  /* **********************************

Code to automatically identify pivots

********************************** */

// -- what will be our lookback range for the hh and ll?
farback=140; //How Far back to go
nBars = 12; //Number of bars

// -- Create 0-initialized arrays the size of barcount

aHPivs = H - H;

aLPivs = L - L;

// -- More for future use, not necessary for basic plotting

aHPivHighs = H - H;

aLPivLows = L - L;

aHPivIdxs = H - H;

aLPivIdxs = L - L;

nHPivs = 0;

nLPivs = 0;

lastHPIdx = 0;

lastLPIdx = 0;

lastHPH = 0;

lastLPL = 0;

curPivBarIdx = 0;

// -- looking back from the current bar, how many bars

// back were the hhv and llv values of the previous

// n bars, etc.?

aHHVBars = HHVBars(H, nBars);

aLLVBars = LLVBars(L, nBars);

aHHV = HHV(H, nBars);

aLLV = LLV(L, nBars);

// -- Would like to set this up so pivots are calculated back from

// last visible bar to make it easy to "go back" and see the pivots

// this code would find. However, the first instance of

// _Trace output will show a value of 0

aVisBars = Status("barvisible");

nLastVisBar = LastValue(Highest(IIf(aVisBars, BarIndex(), 0)));

_TRACE("Last visible bar: " + nLastVisBar);

// -- Initialize value of curTrend

curBar = (BarCount-1);

curTrend = "";

if (aLLVBars[curBar] <

aHHVBars[curBar]) {

curTrend = "D";

}

else {

curTrend = "U";

}

// -- Loop through bars. Search for

// entirely array-based approach

// in future version

for (i=0; i<BarCount; i++) {

curBar = (BarCount - 1) - i;

// -- Have we identified a pivot? If trend is down...

if (aLLVBars[curBar] < aHHVBars[curBar]) {

// ... and had been up, this is a trend change

if (curTrend == "U") {

curTrend = "D";

// -- Capture pivot information

curPivBarIdx = curBar - aLLVBars[curBar];

aLPivs[curPivBarIdx] = 1;

aLPivLows[nLPivs] = L[curPivBarIdx];

aLPivIdxs[nLPivs] = curPivBarIdx;

nLPivs++;

}

// -- or current trend is up

} else {

if (curTrend == "D") {

curTrend = "U";

curPivBarIdx = curBar - aHHVBars[curBar];

aHPivs[curPivBarIdx] = 1;

aHPivHighs[nHPivs] = H[curPivBarIdx];

aHPivIdxs[nHPivs] = curPivBarIdx;

nHPivs++;

}

// -- If curTrend is up...else...

}

// -- loop through bars

}

// -- Basic attempt to add a pivot this logic may have missed

// -- OK, now I want to look at last two pivots. If the most

// recent low pivot is after the last high, I could

// still have a high pivot that I didn't catch

// -- Start at last bar

curBar = (BarCount-1);

candIdx = 0;

candPrc = 0;

lastLPIdx = aLPivIdxs[0];

lastLPL = aLPivLows[0];

lastHPIdx = aHPivIdxs[0];

lastHPH = aHPivHighs[0];

if (lastLPIdx > lastHPIdx) {

// -- Bar and price info for candidate pivot

candIdx = curBar - aHHVBars[curBar];

candPrc = aHHV[curBar];

if (

lastHPH < candPrc AND

candIdx > lastLPIdx AND

candIdx < curBar) {


// -- OK, we'll add this as a pivot...

aHPivs[candIdx] = 1;

// ...and then rearrange elements in the

// pivot information arrays

for (j=0; j<nHPivs; j++) {

aHPivHighs[nHPivs-j] = aHPivHighs[nHPivs-

(j+1)];

aHPivIdxs[nHPivs-j] = aHPivIdxs[nHPivs-(j+1)];

}

aHPivHighs[0] = candPrc ;

aHPivIdxs[0] = candIdx;

nHPivs++;

}

} else {


// -- Bar and price info for candidate pivot

candIdx = curBar - aLLVBars[curBar];

candPrc = aLLV[curBar];

if (

lastLPL > candPrc AND

candIdx > lastHPIdx AND

candIdx < curBar) {


// -- OK, we'll add this as a pivot...

aLPivs[candIdx] = 1;

// ...and then rearrange elements in the

// pivot information arrays

for (j=0; j<nLPivs; j++) {

aLPivLows[nLPivs-j] = aLPivLows[nLPivs-(j+1)];

aLPivIdxs[nLPivs-j] = aLPivIdxs[nLPivs-(j+1)];

}

aLPivLows[0] = candPrc;

aLPivIdxs[0] = candIdx;

nLPivs++;

}

}


//============== EXPLORATION ==============
Buy=Cover=aLPivs==1;
Sell=Short=aHPivs==1;
SellPrice=ValueWhen(Sell,C,1);
BuyPrice=ValueWhen(Buy,C,1);
Long=Flip(Buy,Sell);
Shrt=Flip(Sell,Buy );

//============== Plot price ==============

n = 15;
a =  C > (MA(H,n)+MA(L,n))/2;// then Buy next bar at market;
b = C < (MA(H,n)+MA(L,n))/2;// then Sell Short next bar at market;

state=IIf(BarsSince(a)<BarsSince(b),1,0);

Longs=state==1;
shorts=state==0;

//Chart
Colorbar = IIf(Longs, colorGreen, IIf(Shorts, colorRed, colorGrey40));

Plot( C, "Close", colorbar, styleCandle = 64 | styleNoTitle );


//============== Plot Shape ==============

PlotShapes(

IIf(aHPivs==1, shapeDownArrow, shapeNone), colorOrange, 0,

High, Offset=-12);

PlotShapes(
IIf(aLPivs==1, shapeUpArrow , shapeNone), colorLime, 0,

Low, Offset=-12);

//============== EMA(13) ==============

Plot(EMA(C, 13), "", colorWhite,
        styleLine+styleNoRescale);

//============== TRENDING ==============

DTL=150; // DTL = Define Trend Long
DTM=70;	// DTM = Define Trend Medium
DTS=14;  // DTS = Define Trend Short

TL=LinRegSlope(MA(C, DTL),2);	 // TL = Trend Long
TM=LinRegSlope(MA(C, DTM),2);  // TM = Trend Medium
TS=LinRegSlope(MA(C, DTS),2);  // TS = Trend Short

TLL=IIf(LinRegSlope(MA(C, DTL),2) > 0,True, False);
TMM=IIf(LinRegSlope(MA(C, DTM),2) > 0,True, False);
TSS=IIf(LinRegSlope(MA(C, DTS),2) > 0,True, False);


//============== VOLUME ==============
Vlp=30; //Volume lookback period
Vrg=MA(V,Vlp);
St = StDev(Vrg,Vlp);
Vp3 = Vrg + 3*st;
Vp2 = Vrg + 2*st;;
Vp1 = Vrg + 1*st;;
Vn1 = Vrg -1*st;
Vn2 = Vrg -2*st;

//============== WILLIAM'S %R ==============
WR = ((HHV(H,14) - C) /(HHV (H,14) -LLV (L,14))) *-100;

//============== A/D ==============
TRH = IIf(Ref(C, -1) > H, Ref(C, -1), H);
TRL = IIf(Ref(C, -1) < L, Ref(C, -1), L);
ad = IIf(C > Ref(C, -1), C - TRL, IIf(C < Ref(C, -1), C - TRH, 0));
WAD = Cum(ad);
wu = wad > Ref(wad,-1);
wd = wad < Ref(wad,-1);

//============== MACD ==============
MB= Cross (MACD(), Signal());
MS = Cross( Signal(), MACD());
MB = ExRem(MB, MS);
MS = ExRem(MS, MB);
MB1= MACD() > Signal();
MS1= MACD() < Signal();

//============== STOCH ==============
StochKval = StochK(10,5);
StochDval = StochD(10,5,5);
StochBuy = Cross(StochK(10,5), StochD(10,5,5));
StochSell = Cross (StochD(10,5,5), StochK(10,5));
StBuy=StochK(10,5)>StochD(10,5,5);
StSell=StochK(10,5)<StochD(10,5,5);

//============== ADX ==============
adxBuy =  Cross(PDI(14), MDI(14));
adxSell = Cross(MDI(14), PDI(14));
adxBuy = ExRem(adxBuy, adxSell);
adxSell = ExRem(adxSell, adxBuy);
adxbuy1 = PDI(14) > MDI(14);
adxsell1 = MDI(14)> PDI(14);


//============== TMA ==============
function ZeroLagTEMA( array, period )
{
 TMA1 = TEMA( array, period );
 TMA2 = TEMA( TMA1, period );
 Diff = TMA1 - TMA2;
 return TMA1 + Diff ;
}
haClose = ( haClose + haOpen + haHigh + haLow )/4;
periodtm = 55;
ZLHa = ZeroLagTEMA( haClose, periodtm );
ZLTyp = ZeroLagTEMA( Avg, periodtm );
TMBuy = Cross( ZLTyp, ZLHa );
TMSell = Cross( ZLHa, ZLTyp );
TMBuy1= ZLTyp> ZLHa ;
TMSell1=ZLHa> ZLTyp ;

//============== ZLW ==============
R = ((HHV(H,14) - C) /(HHV (H,14) -LLV (L,14))) *-100;
MaxGraph=10;
PeriodZ= 10;
EMA1= EMA(R,PeriodZ);
EMA2= EMA(EMA1,5);
Difference= EMA1 - EMA2;
ZeroLagEMA= EMA1 + Difference;
PR=100-abs(ZeroLagEMA);
MoveAvg=MA(PR,5);
ZBuy = Cross(PR,moveAvg) AND PR<30;
ZSell = Cross(moveAvg,PR) AND PR>70;
ZBuy1= PR>= MoveAvg AND PR>= Ref(PR,-1) ;
ZSell1=(PR < MoveAvg) OR PR>= MoveAvg AND PR< Ref(PR,-1) ;

//============== RS ==============
p = (H+L+C)/3;
r1 = (2*p)-L;
s1 = (2*p)-H;
r2 = p +(r1 - s1);
s2 = p -(r2 - s1);
R3 = P + (R2 - S2);
S3 = P - (R3 - S2);

//============== IBUY ==============
Ibuy =  Cross(RSI(14), EMA(RSI(14),9));
Isell = Cross(EMA(RSI(14),9), RSI(14));
Ibuy = ExRem(Ibuy, ISell);
Isell = ExRem(ISell, Ibuy);
BlRSI = RSI(14) > EMA(RSI(14),9);
BrRSI = RSI(14) < EMA(RSI(14),9);


//============== TITLE ==============
_SECTION_BEGIN("Title");
if( Status("action") == actionIndicator )
(
Title = EncodeColor(colorGold)+ "Kenzie SR System" + EncodeColor(colorRose)+" (" +  Name() + ") " + EncodeColor(colorGold)+ Interval(2) +
 "  " + Date() +" " +" •  Open "+WriteVal(O,1.0)+"  •  "+"Hi "+WriteVal(H,1.0)+"  •  "+"Lo "+WriteVal(L,1.0)+"  •  "+
"Close "+WriteVal(C,1.0)+" ("+WriteVal(C-Ref(C,-1),1,0)+" "+WriteVal((C-Ref(C,-1))*100/Ref(C,-1),1.1)+ "%)  •  Vol= "+ WriteVal(V,1.0)
+" "+WriteIf(V>Vp2,EncodeColor(colorLime)+"(Very High)",WriteIf(V>Vp1,EncodeColor(colorLime)+"(High)",WriteIf(V>Vrg,EncodeColor(colorLime)+"(Above Average)",
WriteIf(V<Vrg AND V>Vn1,EncodeColor(ColorRGB(255,0,128))+"(Less than Average)",WriteIf(V<Vn1,"(Low)","")))))+EncodeColor(colorGrey50)+"  •  "
+EncodeColor(colorWhite)+"EMA(Close,13) = "+WriteVal(EMA(C,13),1.2)

+"\n"+EncodeColor(colorGrey50)+"--------------------------------------"

+"\n"+EncodeColor(colorGold)+
WriteIf (Buy , "Signal: Go Long - Entry Price: "+WriteVal(C,1.0)+" - Last Exit Price: "+WriteVal((SellPrice),1.0)
+" ("+WriteVal((BuyPrice-SellPrice),1.0)+") - StopLoss: "+WriteVal(C*.97,1.0)+" - Reward Risk Ratio: "+WriteVal((profittaker-C)/(C-C*0.95),1.2)+" - "+EncodeColor(colorLime)+"Strong Buy!"
,"")+


WriteIf (Sell , "Signal: Go Short - Exit Price: "+WriteVal(C,1.0)+" - Profit: "+WriteVal((SellPrice-BuyPrice),1.0)+" ("+WriteVal(((SellPrice-BuyPrice)*100/BuyPrice),1.1)+"%)"+" - Profit Taking!","")+
EncodeColor(ColorRGB(111,208,255))+
WriteIf(Long AND NOT Buy, "Trade: Long - Entry Price: "+WriteVal((BuyPrice),1.0)+" - Profit: "+WriteVal((C-BuyPrice),1.0)+" ("+WriteVal(((C-BuyPrice)*100/BuyPrice),1.1)+"%)"+
" - StopLoss:"+WriteVal((BuyPrice*.97),1.0)+" - Reward Risk Ratio: "+WriteVal((profittaker-BuyPrice)/(BuyPrice-BuyPrice*0.95),1.2)+" - "+EncodeColor(colorLime)+"Let your profit runs!","")+
WriteIf(shrt AND NOT Sell, "Trade: Short - Exit Price: "+WriteVal((SellPrice),1.0)+" - Profit: "+WriteVal((SellPrice-BuyPrice),1.0)+" ("+WriteVal(((SellPrice-BuyPrice)*100/BuyPrice),1.1)+"%) - "+EncodeColor(colorLime)+"Watch for Strong Buy Signal!","")

+"\n"+EncodeColor(colorGrey50)+"--------------------------------------"

+"\n"+EncodeColor(colorGold)+"• Short Term: "+
WriteIf(TS>0 AND TS<0.3,EncodeColor(colorLime)+"Weak Up Trend",
WriteIf(TS>=0.3 AND TS<0.6 ,EncodeColor(colorBrightGreen)+"Medium Up Trend",
WriteIf(TS>=0.6,EncodeColor(colorGreen)+"Strong Up Trend",
WriteIf(TS<0 AND TS>-0.3,EncodeColor(colorPink)+"Weak Down Trend",
WriteIf(TS<=-0.3 AND TS>-0.6 ,EncodeColor(ColorRGB(255,0,128))+"Medium Down Trend",
WriteIf(TS<=-0.6,EncodeColor(colorRed)+"Strong Down Trend",EncodeColor(colorGrey50)+"Sideways"))))))

+"\n"+EncodeColor(colorGold)+"• Mid Term: "+
WriteIf(TM>0 AND TM<0.3,EncodeColor(colorLime)+"Weak Up Trend",
WriteIf(TM>=0.3 AND TM<0.6 ,EncodeColor(colorBrightGreen)+"Medium Up Trend",
WriteIf(TM>=0.6,EncodeColor(colorGreen)+"Strong Up Trend",
WriteIf(TM<0 AND TM>-0.3,EncodeColor(colorPink)+"Weak Down Trend",
WriteIf(TM<=-0.3 AND TM>-0.6 ,EncodeColor(ColorRGB(255,0,128))+"Medium Down Trend",
WriteIf(TM<=-0.6,EncodeColor(colorRed)+"Strong Down Trend",EncodeColor(colorGrey50)+"Sideways"))))))

+"\n"+EncodeColor(colorGold)+"• Long Term: "+
WriteIf(TL>0 AND TL<0.3,EncodeColor(colorLime)+"Weak Up Trend",
WriteIf(TL>=0.3 AND TL<0.6 ,EncodeColor(colorBrightGreen)+"Medium Up Trend",
WriteIf(TL>=0.6,EncodeColor(colorGreen)+"Strong Up Trend",
WriteIf(TL<0 AND TL>-0.3,EncodeColor(colorPink)+"Weak Down Trend",
WriteIf(TL<=-0.3 AND TL>-0.6 ,EncodeColor(ColorRGB(255,0,128))+"Medium Down Trend",
WriteIf(TL<=-0.6,EncodeColor(colorRed)+"Strong Down Trend",EncodeColor(colorGrey50)+"Sideways"))))))

+"\n"+EncodeColor(colorGrey50)+"--------------------------------------"

+"\n"+EncodeColor(47)+"• AccDist(): " + WriteIf(wu,EncodeColor(colorBrightGreen)+"Accumulation",WriteIf(wd,EncodeColor(colorRed)+"Distribution","Neutral"))

+"\n"+ EncodeColor(47) +"• RSI(14): " +WriteIf(RSI(14)>30 AND RSI(14)<70,EncodeColor(colorBrightGreen),WriteIf(RSI(14)<30 ,EncodeColor(07),EncodeColor(colorRed))) + WriteVal(RSI(14),format=1.1)
 +WriteIf(RSI(14)>30 AND RSI(14)<70," Range"+EncodeColor(colorBrightGreen),WriteIf(RSI(14)<30 ," OverSold"+EncodeColor(07)," OverBought"+EncodeColor(colorRed)))

+"\n"+ EncodeColor(47) +"• CCI(14): " +WriteIf(CCI(14)>-100 AND CCI(14)<100,EncodeColor(colorBrightGreen),WriteIf(CCI(14)<-100 ,EncodeColor(07),EncodeColor(colorRed))) + WriteVal(CCI(14),format=1.1)
 +WriteIf(CCI(14)>-100 AND CCI(14)<100," Range"+EncodeColor(colorBrightGreen),WriteIf(CCI(14)<-100 ," OverSold"+EncodeColor(07)," OverBought"+EncodeColor(colorRed)))

+"\n"+ EncodeColor(47) +"• ROC(C,14): " +WriteIf(ROC(C,14)>-10 AND ROC(C,14)<10,EncodeColor(colorBrightGreen),WriteIf(ROC(C,14)<-10 ,EncodeColor(07),EncodeColor(colorRed))) + WriteVal(ROC(C,14),format=1.1)
 +WriteIf(ROC(C,14)>-10 AND ROC(C,14)<10," Range"+EncodeColor(colorBrightGreen),WriteIf(ROC(C,14)<-10 ," OverSold"+EncodeColor(07)," OverBought"+EncodeColor(colorRed)))

+"\n"+ EncodeColor(47) +"• Wm%R(14): " +WriteIf(WR>-80 AND WR<-20,EncodeColor(colorBrightGreen),WriteIf(WR<-80 ,EncodeColor(07),EncodeColor(colorRed))) + WriteVal(WR,format=1.1)
 +WriteIf(WR>-80 AND WR<-20," Range"+EncodeColor(colorBrightGreen),WriteIf(WR<-80 ," OverSold"+EncodeColor(07)," OverBought"+EncodeColor(colorRed)))


+"\n"+EncodeColor(colorGrey50)+"--------------------------------------"

+"\n"+EncodeColor(colorGold)+"• Signal(IBuy): " + WriteIf(Ibuy,EncodeColor(colorBrightGreen)+"BuyWarning",WriteIf(Isell,EncodeColor(colorRed)+"SellWarning",WriteIf(BlRSI,EncodeColor(colorBrightGreen)+"BullishZone",WriteIf(BrRSI,EncodeColor(colorRed)+"BearishZone","Neutral"))))

+"\n"+EncodeColor(colorGold)+"• Signal(TMA): " + WriteIf(TMBuy,EncodeColor(colorBrightGreen)+"Buy",WriteIf(TMSell,EncodeColor(colorRed)+"Sell",WriteIf(TMBuy1,EncodeColor(colorBrightGreen)+"Bullish",WriteIf(TMSell1,EncodeColor(colorRed)+"Bearish","Neutral"))))

+"\n"+EncodeColor(colorGold)+"• Signal(MACD): " + WriteIf(MB,EncodeColor(colorBrightGreen)+"Buy",WriteIf(MS,EncodeColor(colorRed)+"Sell",WriteIf(MB1,EncodeColor(colorBrightGreen)+"Bullish",WriteIf(MS1,EncodeColor(colorRed)+"Bearish","Neutral"))))

+"\n"+EncodeColor(colorGold)+"• Signal(Stoch): " + WriteIf(StochBuy,EncodeColor(colorBrightGreen)+"Buy",WriteIf(StochSell,EncodeColor(colorRed)+"Sell",WriteIf(StBuy,EncodeColor(colorBrightGreen)+"Bullish",WriteIf(StSell,EncodeColor(colorRed)+"Bearish","Neutral"))))

+"\n"+EncodeColor(colorGold)+"• Signal(ADX): " + WriteIf(adxBuy,EncodeColor(colorBrightGreen)+"Buy",WriteIf(adxSell,EncodeColor(colorRed)+"Sell",WriteIf(adxBuy1,EncodeColor(colorBrightGreen)+"Bullish",WriteIf(adxSell1,EncodeColor(colorRed)+"Bearish","Neutral"))))

+"\n"+EncodeColor(colorGrey50)+"--------------------------------------"

+"\n"+ EncodeColor(47) +"• TrStop: " +EncodeColor(colorLime)+ WriteVal(TrailStop,format=1.0)
+ EncodeColor(47) +" TrgPrice: " + EncodeColor(colorLime)+WriteVal(Profittaker,format=1.0)
+"\n"+ EncodeColor(47) +"• R1: " +EncodeColor(colorOrange)+ WriteVal(r1,format=1.0)
+ EncodeColor(47) +" R2: " + EncodeColor(colorOrange)+WriteVal(r2,format=1.0)
+ EncodeColor(47) +" R3: " + EncodeColor(colorOrange)+WriteVal(r3,format=1.0)
+"\n"+ EncodeColor(47) +"• S1: " +EncodeColor(colorOrange)+ WriteVal(s1,format=1.0)
+ EncodeColor(47) +" S2: " + EncodeColor(colorOrange)+WriteVal(s2,format=1.0)
+ EncodeColor(47) +" S3: " + EncodeColor(colorOrange)+WriteVal(s3,format=1.0)

+"\n"+EncodeColor(colorGrey50)+"--------------------------------------"

);


//============== BACKGROUND NAME ==============

pxwidth = Status("pxwidth");
pxheight = Status("pxheight");

GfxSetOverlayMode(1);
GfxSetBkMode(0); // transparent
GfxSelectFont("Amienne", Status("pxheight")/15);
GfxSetTextColor( colorGrey40 );
//GfxTextOut( "Kenzie Sebastian", Status("pxwidth")/5.3, Status("pxheight")/5 );

//============================

////BACKGROUND COLOR////////////////////////////////////////////////////////
//SetChartBkColor(ColorRGB(255,200,255));
//SetChartBkGradientFill( colorPlum, colorPlum);
/////////////////////////////////////////////////////////////////////////////////////


_SECTION_END();

_SECTION_BEGIN("Keltner Bands");
P = ParamField("Price field",-1);
Periods = Param("Periods", 15, 2, 300, 1 );
Width = Param("Width", 2, 0, 10, 0.05 );
Color = ParamColor("Color", colorCycle );
Style = ParamStyle("Style");

CenterLine = MA( P, Periods );
KTop   = CenterLine + Width * ATR( Periods );
KBot = CenterLine - Width * ATR( Periods );

Plot( KTop, "KBTop" + _PARAM_VALUES(), Color, Style );
Plot( KBot, "KBBot" + _PARAM_VALUES(), Color, Style );
_SECTION_END();
16 comments
Leave Comment
Please login here to leave a comment.
Back
Excellent afl
Thanks For ur sharing this afl
Best Regards
Hi It is Nice looking, but not shown results buy/sell on the same day in scan. What to do.?
This code looks into the future and should not be used for current signals.
good code
tanks For someone sharing afl in site
Thanks for sharing
The buy/sell signal are not perfect and they come up after several days are passed
try running the bar replay to see what I mean
Also, on the title bar the open,hi,lo,close dose not give the correct data for the day
looking nice will try it
buy/sell signals are not coming perfectly .. it appears after the trend …
Dear isc0rpi0
Yes you are right. Buy & Sell signal are coming after appearance of 2-3 candles. You must know that there is no trading system in this world, which will help in buying/Selling on Top/Bottom. This system gives you an indication which should also be confirmed with other indicators like RSI, MACD. A little study of Bollinger Band will help you a lot to use this system. This system is good for high liquid & volatile stock & gives you very good signal on 15 Minute chart. You may not catch the stock on Top & Bottom, but i am sure you will earn good profit.
Thanks for sharing the afl, but…
1) The buy/sell signal come up after several candle
2) Sometime buy/sell signal come & disappear after some moment.
3) Also, on the title bar the open,hi,lo,close dose not give the correct data for the day
Thanks Kenzie, for sharing this afl, Terima Kasih.
Stanly
This system doesn’t work.
This system looks in the future.
useless, foolish
It;s so good! Thak for share!
WOWwww ,backtesting result was wonderful .
Excellent
how to scan/explore with this AFL?
When I use Function Scan/ Explore it Don’t show anything