Fibonacci Internal & External Retracements (Modified)) for Amibroker (AFL)
Capitano almost 15 years ago Amibroker (AFL)
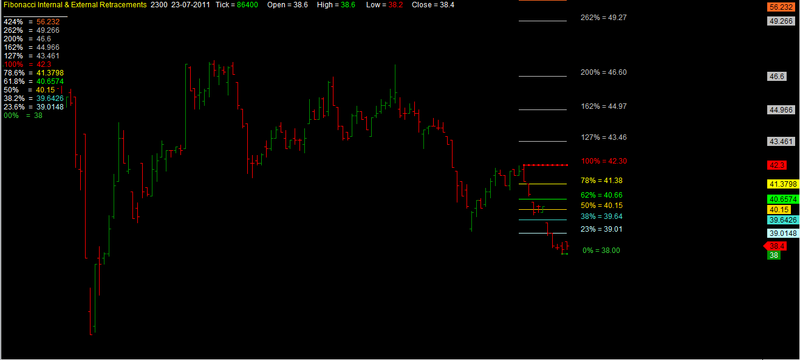
The indicator used to shows the Fibonacci Internal & External Entrancements with Res less than Sup in downtrend.
Now it’s been modified to show the 00% & the 100% instead of (Sup & Res) in the right order.
Screenshots
Indicator / Formula
Copy & Paste Friendly
/* Fibonacci Internal & External Retracements */
// This is a Modified Version that shows Fibonacci 00% & 100% instead of WRONG Sup & Res

_SECTION_BEGIN("Background");
	SetChartOptions(0,chartShowArrows|chartShowDates);
	SetChartBkColor(ParamColor("Outer panel",colorBlack)); // color of outer border
	SetChartBkGradientFill( ParamColor("Inner panel upper",colorBlack),ParamColor("Inner panel lower",colorBlack));
	tchoice=Param("Title Selection ",2,1,2,1);

Plot(C, "", IIf(O>=C, colorRed, colorGreen), ParamStyle("Price Style",styleBar,maskPrice));
//////////////////////////////////////////////////////////////////
_SECTION_BEGIN("Fib Retracements");
	fibs = ParamToggle("Plot Fibs","Off|On",1);
	pctH = Param ("Pivot Hi %", 0.325,0.001,2.0,0.002);
	HiLB = Param ("Hi LookBack",1,1,BarCount-1,1);
	pctL = Param ("Pivot Lo %", 0.325,0.001,2.0,0.002);
	LoLB = Param ("Lo LookBack",1,1,BarCount-1,1);
	Back = Param ("Extend Left = 2",1,1,500,1);
	Fwd  = Param("Plot Forward", 0, 0, 500, 1);
	text = ParamToggle("Plot Text","Off|On",1);
	hts  = Param ("Text Shift", -33.5,-50,50,0.10);
	style =ParamStyle("Line Style",styleLine,styleNoLabel);
x = BarIndex();
pRp  = PeakBars( H, pctH, 1) == 0;
yRp0 = SelectedValue(ValueWhen( pRp, H, HiLB));
xRp0 = SelectedValue(ValueWhen( pRp, x, HiLB));
pSp  = TroughBars( L, pctL, 1) == 0;
ySp0 = SelectedValue(ValueWhen( pSp, L, LoLB));
xSp0 = SelectedValue(ValueWhen( pSp, x, LoLB));
Delta = yRp0 - ySp0;

function fib(ret)
{
retval = (Delta * ret);
Fibval = IIf(ret < 1.0
AND xSp0 < xRp0, yRp0 - retval, IIf(ret < 1.0
AND xSp0 > xRp0, ySp0 + retval,IIf(ret > 1.0
AND xSp0 < xRp0, yRp0 - retval, IIf(ret > 1.0
AND xSp0 > xRp0, ySp0 + retval, Null))));
return FibVal;
}

x0 = Min(xSp0,xRp0)-Back;
x1 = (BarCount -1);
//////////////////////////////////////////////////////////////////
r236 = fib(0.236);	r236I = LastValue (r236,1);
r382 = fib(0.382);	r382I = LastValue (r382,1);
r050 = fib(0.50);		r050I = LastValue (r050,1);
r618 = fib(0.618);	r618I = LastValue (r618,1);
r786 = fib(0.786);	r786I = LastValue (r786,1);
e127 = fib(1.27);		e127I = LastValue (e127,1);
e162 = fib(1.62);		e162I = LastValue (e162,1);
e200 = fib(2.00);		e200I = LastValue (e200,1);
e262 = fib(2.62);		e262I = LastValue (e262,1);
e424 = fib(4.24);		e424I = LastValue (e424,1);
//////////////////////////////////////////////////////////////////
p00 = IIf(xSp0 > xRp0,ySp0,yRp0); 	p00I = LastValue (p00,1);
p100 = IIf(xSp0 < xRp0,ySp0,yRp0); 	p100I = LastValue (p100,1);
color00 =IIf(xSp0 > xRp0,colorLime,colorRed);
color100 =IIf(xSp0 < xRp0,colorLime,colorRed);
//////////////////////////////////////////////////////////////////
numbars = LastValue(Cum(Status("barvisible")));
fraction= IIf(StrRight(Name(),3) == "", 3.2, 3.2);
//////////////////////////////////////////////////////////////////
if(fibs==1)
{
Plot(LineArray(xRp0-Fwd,yRp0,x1,yRp0,Back),"PR",32,8|styleNoRescale,Null,
Null,Fwd);
Plot(LineArray(xSp0-Fwd,ySp0,x1,ySp0,Back),"PS",27,8|styleNoRescale,Null,
Null,Fwd);
Plot(LineArray(x0-Fwd,r236,x1,r236,Back),"",45,style|styleNoRescale,Null,
Null,Fwd);
Plot(LineArray(x0-Fwd,r382,x1,r382,Back),"",44,style|styleNoRescale,Null,
Null,Fwd);
Plot(LineArray(x0-Fwd,r050,x1,r050,Back),"",41,style|styleNoRescale,Null,
Null,Fwd);
Plot(LineArray(x0-Fwd,r618,x1,r618,Back),"",43,style|styleNoRescale,Null,
Null,Fwd);
Plot(LineArray(x0-Fwd,r786,x1,r786,Back),"",42,style|styleNoRescale,Null,
Null,Fwd);
Plot(LineArray(x0-Fwd,e127,x1,e127,Back),"e127",47,style|styleNoRescale,Null,
Null,Fwd);
Plot(LineArray(x0-Fwd,e162,x1,e162,Back),"e162",47,style|styleNoRescale,Null,
Null,Fwd);
Plot(LineArray(x0-Fwd,e200,x1,e200,Back),"p200",47,style|styleNoRescale,Null,
Null,Fwd);
Plot(LineArray(x0-Fwd,e262,x1,e262,Back),"p262",47,style|styleNoRescale,Null,
Null,Fwd);
Plot(LineArray(x0-Fwd,e424,x1,e424,Back),"p424",25,style|styleNoRescale,Null,
Null,Fwd);
}
//////////////////////////////////////////////////////////////////
if(text==1)
{
PlotText(" 0% = " + WriteVal(p00,fraction),
	LastValue(BarIndex())-(numbars/hts), p00I  + 0.05, color00);
PlotText("23% = " + WriteVal(r236,fraction),
LastValue(BarIndex())-(numbars/hts), r236I + 0.05, 45);
PlotText("38% = " + WriteVal(r382,fraction),
LastValue(BarIndex())-(numbars/hts), r382I + 0.05, 44);
PlotText("50% = " + WriteVal(r050,fraction),
LastValue(BarIndex())-(numbars/hts), r050I + 0.05, 41);
PlotText("62% = " + WriteVal(r618,fraction),
LastValue(BarIndex())-(numbars/hts), r618I + 0.05, 43);
PlotText("78% = " + WriteVal(r786,fraction),
LastValue(BarIndex())-(numbars/hts), r786I + 0.05, 42);
PlotText("100% = " + WriteVal(p100,fraction),
LastValue(BarIndex())-(numbars/hts),p100I + 0.05, color100);
PlotText("127% = " + WriteVal(e127,fraction),
LastValue(BarIndex())-(numbars/hts),e127I + 0.05, 47);
PlotText("162% = " + WriteVal(e162,fraction),
LastValue(BarIndex())-(numbars/hts),e162I + 0.05, 47);
PlotText("200% = " + WriteVal(e200,fraction),
LastValue(BarIndex())-(numbars/hts),e200I + 0.05, 47);
PlotText("262% = " + WriteVal(e262,fraction),
LastValue(BarIndex())-(numbars/hts),e262I + 0.05, 47);
PlotText("424% = " + WriteVal(e424,fraction),
LastValue(BarIndex())-(numbars/hts),e424I + 0.05, 25);
}
_SECTION_END();
//////////////////////////////////////////////////////////////////
if (tchoice==1 )
{
_N(Title = EncodeColor(colorWhite)+StrFormat(" {{NAME}} -   {{INTERVAL}}
{{Date}}    Open:  %g,    High:  %g,     Low:  %g,     Close:  %g
{{VALUES}}",O, H, L, C, SelectedValue( ROC( C, 1   ) ) ));
}
//////////////////////////////////////////////////////////////////
if (tchoice==2 )
{
Title = EncodeColor(colorYellow) + "Fibonacci Internal & External Retracements  " +  EncodeColor(colorWhite) + Name() + "  " + EncodeColor(colorWhite)+  Date() + "   Tick = " + EncodeColor(5) +
Interval()+
EncodeColor(colorWhite) + "     Open = " + EncodeColor(colorWhite) + O +
EncodeColor(colorWhite) + "     High = " + EncodeColor(5) + H +
EncodeColor(colorWhite) + "      Low = " + EncodeColor(colorRed) + L +
EncodeColor(colorWhite) + "     Close = " + EncodeColor(colorWhite) + C + "\n"
+
EncodeColor( colorWhite) +"_______________"+"\n"+
EncodeColor( colorWhite)  + "424%   =  "	+ 	EncodeColor(25)+ e424 + " " +"\n"+
EncodeColor( colorWhite)  + "262%   =  "	+ 	EncodeColor(47)+ e262 + " " +"\n"+
EncodeColor( colorWhite)  + "200%   =  "	+ 	EncodeColor(47)+ e200 + " " +"\n"+
EncodeColor( colorWhite)  + "162%   =  "	+ 	EncodeColor(47)+ e162 + " " +"\n"+
EncodeColor( colorWhite)  + "127%   =  "	+ 	EncodeColor(47)+ e127 + " " +"\n"+
EncodeColor( Color100)  + "100%   =  "	+ EncodeColor(Color100) + p100 + " "+"\n"+
EncodeColor( colorWhite)  + "78.6%  =  "	+	EncodeColor(42)+ r786 + " " +"\n"+
EncodeColor( colorWhite)  + "61.8%  =  "	+ 	EncodeColor(43)+ r618 + " "+"\n"+
EncodeColor( colorWhite)  + "50%     =  "	+ 	EncodeColor(41)+ r050 + " "+"\n"+
EncodeColor( colorWhite)  + "38.2%  =  "	+ 	EncodeColor(44)+ r382 + " "+"\n"+
EncodeColor( colorWhite)  + "23.6%  =  "	+ 	EncodeColor(45)+ r236+ " " +"\n"+
EncodeColor( Color00)  + "00%    =  " + 	EncodeColor(Color00) + p00 + " " ;
}
GraphXSpace=5;
4 comments
Leave Comment
Please login here to leave a comment.
nice.thanks
I fail to see what you accomplished as the Fibonacci charting tool produces exactly the same results. Can you post some charts that show the difference that you refer to?
Here we are, hope it’s OK now.
still shows same problem with some charts