Stock Portfolio Organizer
The ultimate porfolio management solution.
Shares, Margin, CFD's, Futures and Forex
EOD and Realtime
Dividends and Trust Distributions
And Much More ....
WiseTrader Toolbox
#1 Selling Amibroker Plugin featuring:
Advanced Adaptive Indicators
Advanced Pattern Exploration
Neural Networks
And Much More ....
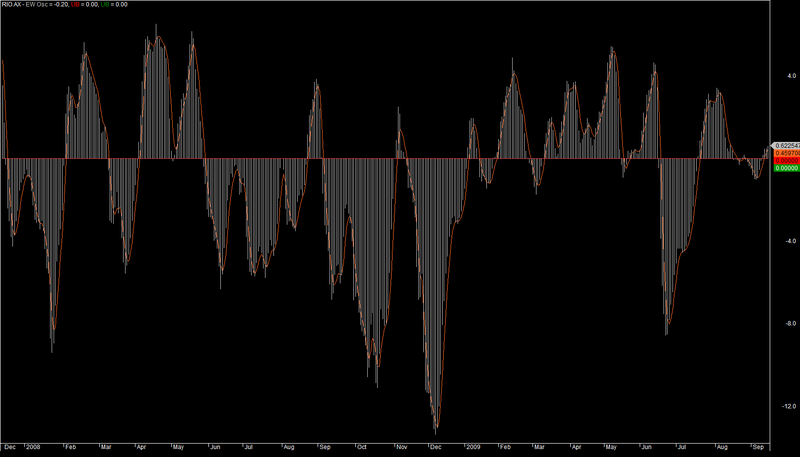
AdGet XTL osc ( eq to EW osc) for Amibroker (AFL)
Rating:
3 / 5 (Votes 2)
Tags:
oscillator, amibroker
I got this from other forum.
I have added few lines extracode for osc to show bars. Add this as on osc at the bottom of the chart
Verygood when you add it to other trending indicators
thanks
Screenshots
Similar Indicators / Formulas
Febo RSI ..real indicator
Submitted
by abhinavsingh over 12 years ago
Trading Volume Statistic
Submitted
by tuanstock1 almost 10 years ago
Ergodic Oscillator
Submitted
by dljtrader over 13 years ago
3 Days Track
Submitted
by janet0211 almost 14 years ago
Chande Momentum Oscillator
Submitted
by klimpek over 13 years ago
BoH Risk Aversion Indicator
Submitted
by genkumag over 12 years ago
Indicator / Formula
Copy & Paste Friendly
// EW STUFF

_SECTION_BEGIN("AA Adget XTL");

price1=EMA((H+L)/2,5)-EMA((H+L)/2,17);
k=1;
k2=0.0555;
Lens=5;
upperband=Price1+k2*(k*Price1-price1);
Lowerband=Price1+K2*(K*Price1-price1);
Plot(Price1,"EW Osc",colorLightGrey,styleHistogram);
Plot(IIf(price1>0 AND BarsSince(Price1)>=2 ,upperband,0),"UB",colorRed,styleLine);
Plot(IIf(price1<0 AND BarsSince(Price1)>=2 ,Lowerband,0),"UB",colorGreen,styleLine);
Plot(WMA(Price1,Lens),"",colorOrange,styleLine);

colordots = IIf(WMA(Price1,Lens) > 0,colorGreen,IIf(WMA(Price1,Lens) < 0,colorRed,colorWhite));
//Plot(WMA(Price1,Lens),"",colordots,styleThick);

EW = WMA(Price1,Lens);

Buy_EW = Cross(EW,0);
Sell_EW = Cross(0,EW);


Buy_EW = ExRem(Buy_EW, sell_EW   );
sell_EW = ExRem(sell_EW , Buy_EW  );

dist = 1.5*ATR(10);
for( i = 0; i < BarCount; i++ )
{

HH1 = HHV(H,1);
LL1 = LLV(L,1);

if( Buy_EW[i] ) PlotText( "E@" + C[ i ], i, L[ i ]-dist[i], colorBlack, colorSeaGreen);
if( sell_EW[i] ) PlotText( "E@" + C[ i ], i, H[ i ]+dist[i], colorWhite, colorDarkRed);

}

PlotShapes(Buy_EW*shapeHollowUpArrow,colorBrightGreen, 0, Low, Offset =-5);
PlotShapes(sell_EW*shapeHollowDownArrow,colorWhite, 0, High, Offset =-5);
_SECTION_END();
0 comments
Leave Comment
Please login here to leave a comment.
Back