Stock Portfolio Organizer
The ultimate porfolio management solution.
Shares, Margin, CFD's, Futures and Forex
EOD and Realtime
Dividends and Trust Distributions
And Much More ....
WiseTrader Toolbox
#1 Selling Amibroker Plugin featuring:
Advanced Adaptive Indicators
Advanced Pattern Exploration
Neural Networks
And Much More ....
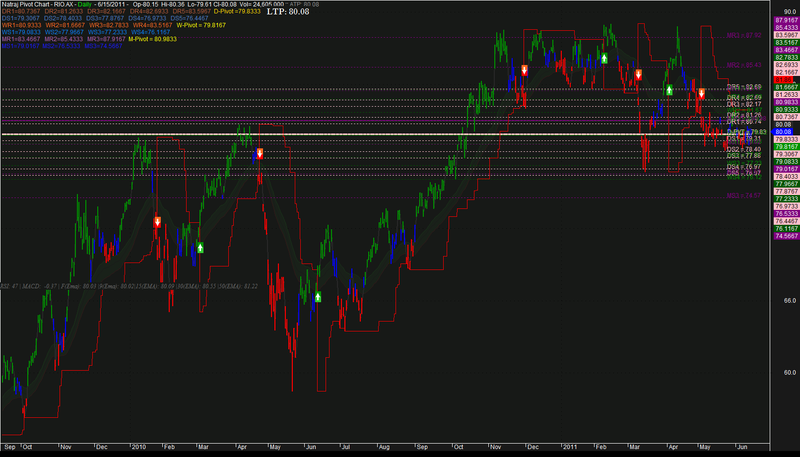
Nataraj modified for Amibroker (AFL)
Rating:
4 / 5 (Votes 4)
Tags:
trading system, amibroker, pivots
nataraj mdified with swing xtl and all time fram pivots with diffrent color
Screenshots
Similar Indicators / Formulas
Peak & Valley
Submitted
by mahesh.aranake over 13 years ago
MPLite--KAKA & Heinkin Ashi & NickMA
Submitted
by pharaoh over 13 years ago
CAMARILLA S1-R1 (tiger)
Submitted
by tigernifty over 12 years ago
Lakshmi buy sell signals
Submitted
by rani over 13 years ago
Isfandi Trading System II
Submitted
by isfandi about 13 years ago
Kenzie_Enhanced
Submitted
by vargasc1 over 12 years ago
Indicator / Formula
Copy & Paste Friendly
_SECTION_BEGIN("Natraj Pivot Chart");
_SECTION_BEGIN("xtl");

SetChartBkColor(ParamColor("Outer panel color ",colorLightGrey));
tgt = 37;
a = CCI(20) < -tgt;
b = CCI(20) > tgt;
state = IIf(a>b,-1,IIf(a==b,0,1));
Color = IIf(state == 0, colorBlue, IIf(state == 1, colorGreen, IIf(state == -1, colorRed, 0)));

//Plot(state, "", color, styleHistogram);

SetChartOptions( 0, chartShowDates | chartShowArrows | chartLogarithmic | chartWrapTitle );
_N(Title = StrFormat("{{NAME}} - {{INTERVAL}} {{DATE}} Open %g, Hi %g, Lo %g, Close %g (%.1f%%) {{VALUES}}", O, H, L, C, SelectedValue( ROC( C, 1 ) ) ));
Plot( C, "Close", color, styleNoTitle |styleBar|styleThick);


  _SECTION_BEGIN("KPL Swing");
//Copyright Kamalesh Langote. Email:kpl@vfmdirect.com. More details at http://www.vfmdirect.com/kplswing
//Save indicator as "kplswing.afl" in C: program files > Amibroker > Formulas > Custom folder and then drap and drop on price chart
no=Param( "Swing", 20, 1, 55 );
tsl_col=ParamColor( "Color", colorCycle );

res=HHV(H,no);
sup=LLV(L,no);
avd=IIf(C>Ref(res,-1),1,IIf(C<Ref(sup,-1),-1,0));
avn=ValueWhen(avd!=0,avd,1);
tsl=IIf(avn==1,sup,res);

Plot(tsl, _DEFAULT_NAME(), tsl_col, styleStaircase |styleThick); // or styleaArea


Buy=Cross(C,tsl);
Sell=Cross(tsl,C);
PlotShapes(IIf(Buy, shapeSquare, shapeNone),colorGreen, 0, L, Offset=-40);
PlotShapes(IIf(Buy, shapeSquare, shapeNone),colorLime, 0,L, Offset=-50);
PlotShapes(IIf(Buy, shapeUpArrow, shapeNone),colorWhite, 0,L, Offset=-45);
PlotShapes(IIf(Sell, shapeSquare, shapeNone),colorRed, 0, H, Offset=40);
PlotShapes(IIf(Sell, shapeSquare, shapeNone),colorOrange, 0,H, Offset=50);
PlotShapes(IIf(Sell, shapeDownArrow, shapeNone),colorWhite, 0,H, Offset=-45);

_SECTION_END();

_SECTION_BEGIN("pivots mw");
SetChartBkColor(2) ;
k=IIf(ParamList("select type","daily|next day")=="daily",-1,0);
k1=-1;
TimeFrameSet(inDaily);
day_h= LastValue(Ref(H,K));
day_l= LastValue(Ref(L,K));
day_c= LastValue(Ref(C,K));
TimeFrameRestore();

TimeFrameSet(inWeekly);
Week_h= LastValue(Ref(H,K1));
Week_l= LastValue(Ref(L,K1));;
Week_c= LastValue(Ref(C,K1));;
TimeFrameRestore();

TimeFrameSet(inMonthly);
month_h= LastValue(Ref(H,K1));
month_l= LastValue(Ref(L,K1));
month_c= LastValue(Ref(C,K1));
TimeFrameRestore();

/*--------------------------------------*/
// day
DH=Day_h;
DL=Day_L;
DC=Day_C;

// DAY PIVOT Calculation
pd = ( DH+ DL + DC )/3;
sd1 = (2*pd)-DH;
sd2 = pd -(DH - DL);
sd3 = Sd1 - (DH-DL);
sd4 = Sd2 - (DH-DL);
sd5 = Sd3 - (DH-DL);
rd1 = (2*pd)-DL;
rd2 = pd +(DH -DL);
rd3 = rd1 +(DH-DL);
rd4 = rd2 +(DH-DL);
rd5 = rd3 +(DH-DL);
dp=pd;
// week
WH=Week_h;
WL=Week_l;
WC=Week_c;

// WEEK PIVOT Calculation
pw = ( WH+ WL + WC )/3;
sw1 = (2*pw)-WH;
sw2 = pw -(WH - WL);
sw3 = Sw1 - (WH-WL);
sw4 = Sw2 - (WH-WL);
rw1 = (2*pw)-WL;
rw2 = pw +(WH -WL);
rw3 = rw1 +(WH-WL);
rw4 = rw2 +(WH-WL);


// month
MH=month_h;
ML=month_l;
MC=month_c;

// MONTH PIVOT Calculation
pm = ( MH+ ML + MC )/3;
sm1 = (2*pm)-MH;
sm2 = pm -(MH - ML);
sm3 = Sm1 - (MH-ML);
rm1 = (2*pm)-ML;
rm2 = pm +(MH -ML);
rm3 = rm1 +(MH-ML);

ppl = ParamToggle("Plot Pivot Levels","Off|On",1);
numbars = LastValue(Cum(Status("barvisible")));
fraction= IIf(StrRight(Name(),3) == "", 3.2, 3.2);
hts = Param("slide all",33,-1000,1000,1);


{
if(ppl==1) {
Plot(pd,"",colorPink,styleLine|styleDots|styleThick|styleNoRescale);
Plot(sd1,"",colorPink,styleDashed|styleNoRescale);
Plot(sd2,"",colorPink, styleDashed|styleNoRescale);
Plot(sd3,"",colorPink, styleDashed|styleNoRescale);
Plot(sd4,"",colorPink, styleDashed|styleNoRescale);
Plot(sd5,"",colorPink, styleDashed|styleNoRescale);
Plot(rd1,"",colorPink, styleDashed|styleNoRescale);
Plot(rd2,"",colorPink, styleDashed|styleNoRescale);
Plot(rd3,"",colorPink, styleDashed|styleNoRescale);
Plot(rd4,"",colorPink, styleDashed|styleNoRescale);
Plot(rd5,"",colorPink, styleDashed|styleNoRescale);

Plot(pw,"",colorGreen,styleLine|styleDots|styleThick|styleNoRescale);
Plot(sw1,"",colorDarkGreen, styleDashed|styleNoRescale);
Plot(sw2,"",colorDarkGreen, styleDashed|styleNoRescale);
Plot(sw3,"",colorDarkGreen, styleDashed|styleNoRescale);
Plot(sw4,"",colorDarkGreen, styleDashed|styleNoRescale);
Plot(rw1,"",colorDarkGreen, styleDashed|styleNoRescale);
Plot(rw2,"",colorDarkGreen, styleDashed|styleNoRescale);
Plot(rw3,"",colorDarkGreen, styleDashed|styleNoRescale);
Plot(rw4,"",colorDarkGreen, styleDashed|styleNoRescale);


Plot(pm,"",colorViolet,styleLine|styleDots|styleThick|styleNoRescale);
Plot(sm1,"",colorViolet, styleDashed|styleNoRescale);
Plot(sm2,"",colorViolet, styleDashed|styleNoRescale);
Plot(sm3,"",colorViolet, styleDashed|styleNoRescale);
Plot(rm1,"",colorViolet, styleDashed|styleNoRescale);
Plot(rm2,"",colorViolet, styleDashed|styleNoRescale);
Plot(rm3,"",colorViolet, styleDashed|styleNoRescale);

i=1;

PlotText(" D-PVT = " + WriteVal(pd,fraction), LastValue(BarIndex())-(numbars/Hts), dp, colorPink);
PlotText(" DR1 = " + WriteVal(rd1,fraction), LastValue(BarIndex())-(numbars/Hts), rd1 , colorPink);
PlotText(" DS1 = " + WriteVal(sd1,fraction), LastValue(BarIndex())-(numbars/Hts), sd1 , colorPink);
PlotText(" DR2 = " + WriteVal(rd2,fraction), LastValue(BarIndex())-(numbars/Hts), rd2 , colorPink);
PlotText(" DS2 = " + WriteVal(sd2,fraction), LastValue(BarIndex())-(numbars/Hts), sd2 , colorPink);
PlotText(" DR3 = " + WriteVal(rd3,fraction), LastValue(BarIndex())-(numbars/Hts), rd3 , colorPink);
PlotText(" DS3 = " + WriteVal(sd3,fraction), LastValue(BarIndex())-(numbars/Hts), sd3 , colorPink);
PlotText(" DR4 = " + WriteVal(rd4,fraction), LastValue(BarIndex())-(numbars/Hts), rd4 , colorPink);
PlotText(" DS4 = " + WriteVal(sd4,fraction), LastValue(BarIndex())-(numbars/Hts), sd4 , colorPink);
PlotText(" DR5 = " + WriteVal(rd4,fraction), LastValue(BarIndex())-(numbars/Hts), rd5 , colorPink);
PlotText(" DS5 = " + WriteVal(sd4,fraction), LastValue(BarIndex())-(numbars/Hts), sd5 , colorPink);

PlotText(" W-PVT = " + WriteVal(pw,fraction), LastValue(BarIndex())-(numbars/Hts), pw , colorGreen);

PlotText(" WR1 = " + WriteVal(rw1,fraction), LastValue(BarIndex())-(numbars/Hts), rw1 , colorGreen);
PlotText(" WS1 = " + WriteVal(sw1,fraction), LastValue(BarIndex())-(numbars/Hts), sw1 , colorGreen);
PlotText(" WR2 = " + WriteVal(rw2,fraction), LastValue(BarIndex())-(numbars/Hts), rw2 , colorGreen);
PlotText(" WS2 = " + WriteVal(sw2,fraction), LastValue(BarIndex())-(numbars/Hts), sw2 , colorGreen);
PlotText(" WR3 = " + WriteVal(rw3,fraction), LastValue(BarIndex())-(numbars/Hts), rw3 , colorGreen);
PlotText(" WS3 = " + WriteVal(sw3,fraction), LastValue(BarIndex())-(numbars/Hts), sw3 , colorGreen);
PlotText(" WR4 = " + WriteVal(rw4,fraction), LastValue(BarIndex())-(numbars/Hts), rw4 , colorGreen);
PlotText(" WS4 = " + WriteVal(sw4,fraction), LastValue(BarIndex())-(numbars/Hts), sw4 , colorGreen);

PlotText(" M-PVT = " + WriteVal(pm,fraction), LastValue(BarIndex())-(numbars/Hts), pm , colorViolet);

PlotText(" MR1 = " + WriteVal(rm1,fraction), LastValue(BarIndex())-(numbars/Hts), rm1 ,colorViolet );
PlotText(" MS1 = " + WriteVal(sm1,fraction), LastValue(BarIndex())-(numbars/Hts), sm1 ,colorViolet );
PlotText(" MR2 = " + WriteVal(rm2,fraction), LastValue(BarIndex())-(numbars/Hts), rm2 ,colorViolet);
PlotText(" MS2 = " + WriteVal(sm2,fraction), LastValue(BarIndex())-(numbars/Hts), sm2 , colorViolet);
PlotText(" MR3 = " + WriteVal(rm3,fraction), LastValue(BarIndex())-(numbars/Hts), rm3 , colorViolet);
PlotText(" MS3 = " + WriteVal(sm3,fraction), LastValue(BarIndex())-(numbars/Hts), sm3 , colorViolet);

}}

//--end----------------------------------------------------------------------------
_SECTION_END();

/*--------------------------------------*/

// TEXT
"high  = "+H;
"low   =  "+L;
"close = "+C;

_SECTION_BEGIN("ATP");
Atp=ParamToggle("ATP","Off|On",1);
if(Atp==1)
{


DayChange = Day() != Ref(Day(), -1);
AvgTradePrice = Null;
CurDayBars = 0;
CurDayCloseSum = 0;

for (i = 0; i < BarCount; i++)
{
if (DayChange[i])
{
CurDayCloseSum = C[i];
CurDayBars = 1;
}
else
{
CurDayCloseSum = CurDayCloseSum + C[i];
CurDayBars++;
}
AvgTradePrice[i] = CurDayCloseSum / CurDayBars;
}
Plot(AvgTradePrice, "AvgTradePrice",colorDarkGrey,styleThick);
ATP=AvgTradePrice;

_SECTION_END();}


_SECTION_BEGIN("Title");
if( Status("action") == actionIndicator )
(
Title = EncodeColor(colorWhite)+ "Natraj Pivot Chart" + " - " +  Name() + " - " + EncodeColor(colorBrightGreen)+ Interval(2) + EncodeColor(colorWhite) +
 "  - " + Date() +" - "+"  "+EncodeColor(colorWhite) +"Op-"+O+"  "+"Hi-"+H+"  "+"Lo-"+L+" "+
"Cl-"+C+"  "+ "Vol= "+ WriteVal(V)+ " :: "+EncodeColor(ColorRGB(140,140,140)) + "ATP: "+ATP+"\n" + EncodeColor(ColorRGB(175,90,59)) + "DR1="+rd1+"   "+"DR2="+rd2+"   "+"DR3="+rd3+"   "+"DR4="+rd4+"   "+"DR5="+rd5+"  "+EncodeColor(colorGold) +  "D-Pivot ="+pd+"\n"+
EncodeColor(ColorRGB(73,123,201)) + "DS1="+sd1+"   "+"DS2="+sd2+"   "+"DS3="+sd3+"   "+"DS4="+sd4+"   "+"DS5="+sd5+"\n"+
EncodeColor(colorOrange) + "WR1="+rw1+"   "+"WR2="+rw2+"   "+"WR3="+rw3+"   "+"WR4="+rw4+"   "+EncodeColor(colorYellow) + "W-Pivot = "+pw+"\n"+
EncodeColor(ColorRGB(9,128,250)) + "WS1="+sw1+"   "+"WS2="+sw2+"   "+"WS3="+sw3+"   "+"WS4="+sw4+"\n"+
EncodeColor(ColorRGB(175,96,175)) + "MR1="+rm1+"   "+"MR2="+rm2+"   "+"MR3="+rm3+"  "+EncodeColor(colorYellow) +   "M-Pivot = "+pm+"\n"+
EncodeColor(ColorRGB(25,25,255))  + "MS1="+sm1+"  "+"MS2="+sm2+"   "+"MS3="+sm3);

_SECTION_END();


fsma=ParamToggle("Moving Avg","Off|On",0);

if(fsma==1)
{
_SECTION_BEGIN("FAST");
Periods = Param("periods", 15, 2, 300, 1, 10 );
Plot( EMA( C, Periods ),_DEFAULT_NAME(), ParamColor("colorfast",ColorRGB(5,69,140)), styleNoLabel,styleDashed);
_SECTION_END();

_SECTION_BEGIN("SLOW");
Periods = Param("periods",30, 2, 300, 1, 10 );
Plot( EMA( C, Periods ), _DEFAULT_NAME(),ParamColor("colorslow", ColorRGB(145,60,55)),styleNoLabel,styleDashed);

_SECTION_END();

_SECTION_BEGIN("50");
Periods = Param("periods",50, 1, 300, 1);
Plot( EMA( C, Periods ), _DEFAULT_NAME(),ParamColor("colors50", ColorRGB(150,100,50)),styleNoLabel,styleDashed);

_SECTION_END();

_SECTION_BEGIN("90");
Periods = Param("periods",90, 1, 300, 1);
Plot(MA( C, Periods ), _DEFAULT_NAME(),ParamColor("colors50", ColorRGB(240,190,140)),styleNoLabel,styleDashed);

_SECTION_END();}

segretribbon= ParamToggle("Ribbon","Off|On",1);
if(segretribbon==1)
{
_SECTION_BEGIN("MID");

Periods =Param("periods",34,2,300,1,10);
Plot(EMA(C,Periods),_DEFAULT_NAME(),  ColorRGB(25,25,25),styleNoLabel,styleLine);
_SECTION_END();

_SECTION_BEGIN("UL");
Periods = Param("periods", 34, 2, 300, 1, 10 );
Plot( EMA(High, Periods ),_DEFAULT_NAME(), ColorRGB(25,50,25), styleNoLabel,styleLine);

_SECTION_END();

_SECTION_BEGIN("LL");

Periods = Param("periods", 34, 2, 300, 1, 10 );
Plot( EMA( Low, Periods ),_DEFAULT_NAME(), ColorRGB(50,25,25), styleNoLabel,styleLine);
_SECTION_END();}

_SECTION_BEGIN("Cloud Setting");
//Cloud

CloudResColor=ParamColor("CloudResColor",ColorRGB(25,33,25));
CR=EMA(H,34);
CS=EMA(L,34);

if(segretribbon == 1)
{
    PlotOHLC( CS, CS, CR,CR, "Band", CloudResColor, styleCloud | styleNoLabel|styleNoTitle);
}

_SECTION_END();


_SECTION_BEGIN("Display");
Display= ParamToggle("Display","Off|On",1);
if(Display==1)
{
x=Param("xposn",0,0,1000,1);
y=Param("yposn",569,0,1000,1);

GfxSetBkColor(ColorRGB(23,25,23));
GfxSelectFont( "Times New Roman",9,500, True);
GfxSetTextColor( colorGrey40);
GfxTextOut("RSI: "+WriteVal(RSI(14),1.0)+" | MACD:  "+WriteVal(MACD(),1.2)+" | F(Ema): "+NumToStr(EMA(C,5),1.2)+" |9(Ema): "+NumToStr(EMA(C,9),1.2)+"
|15(EMA): "+NumToStr(EMA(C,15),1.2)+" |30(EMA): "+NumToStr(EMA(C,30),1.2)+" |50(EMA): "+NumToStr (EMA(C,50),1.2), x, y );

cx=Param("cxposn",537,0,1000,1);
cy=Param("cyposn",12,0,1000,1);

GfxSetBkColor(ColorRGB(23,25,23));
GfxSelectFont( "Bodoni MT",14,50, False);
GfxSetTextColor( colorWhite);
GfxTextOut("LTP: "+C+" ", cx, cy );
 _SECTION_END();}


_SECTION_BEGIN("Background Color");
BKswitch = ParamToggle("Background Color","On,Off");

OUTcolor = ParamColor("Outer Panel Color",ColorRGB(25,25,25));
INUPcolor = ParamColor("Inner Panel Upper",ColorRGB(23,25,23));
INDNcolor = ParamColor("Inner Panel Lower",ColorRGB(23,25,23));
TitleColor = ParamColor("Title Color ",ColorRGB(23,25,23));

if (NOT BKswitch)
{
SetChartBkColor(OUTcolor); // color of outer border
SetChartBkGradientFill(INUPcolor,INDNcolor,TitleColor); // color of inner panel
}
1 comments
Leave Comment
Please login here to leave a comment.
Back
pivot values are not matching