Stock Portfolio Organizer
The ultimate porfolio management solution.
Shares, Margin, CFD's, Futures and Forex
EOD and Realtime
Dividends and Trust Distributions
And Much More ....
WiseTrader Toolbox
#1 Selling Amibroker Plugin featuring:
Advanced Adaptive Indicators
Advanced Pattern Exploration
Neural Networks
And Much More ....
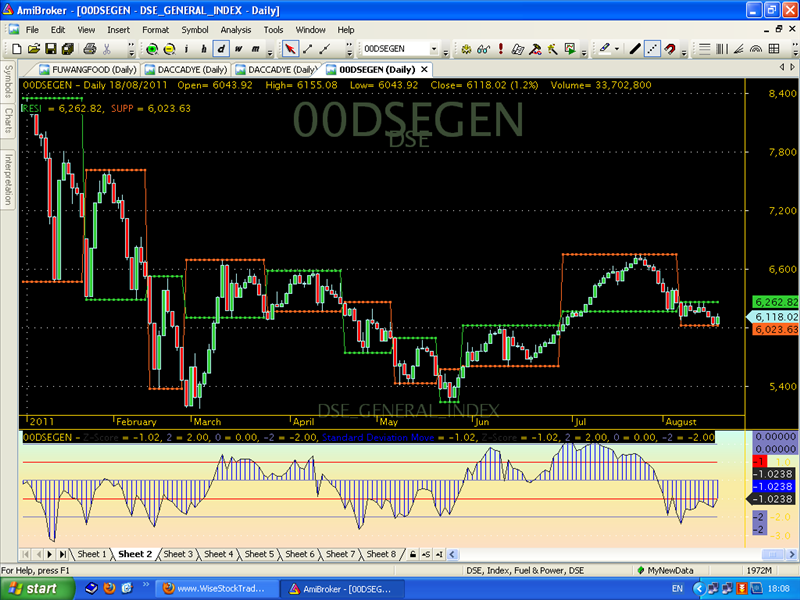
StdDev move and Z-Score mix for Amibroker (AFL)
Rating:
3 / 5 (Votes 2)
Tags:
amibroker
I told you earlier that i am not a coder/programmer but like to trics/tweaks with due respect to original creator .this time i jist mix 2 afl z-score and standard deviation move and found something interesting.
Screenshots
Similar Indicators / Formulas
Kavach Of Karna v2
Submitted
by hbkwarez almost 10 years ago
Advanced Elliott Waves
Submitted
by MarcosEn over 12 years ago
3_6Day GuaiLiLv
Submitted
by motorfly over 12 years ago
Williams Alligator System
Submitted
by durgesh1712 over 12 years ago
Interactive Linear Regression Channel
Submitted
by InternetWorm over 12 years ago
*Level Breakout system*
Submitted
by Tinych over 12 years ago
Indicator / Formula
Copy & Paste Friendly
/*-----------------------------------------------------------
MTR Investors Group - www.MTRIG.com

Statistical Z-Score Indicator: Tracks how many standard
deviations the price is from the mean.

For more information on this indicator see the links below.

MTRIG - Reference
http://blog.mtrig.com/mtrig/blog/page/Z-Score-Indicator.aspx

Z-Score Trader's Notebook Article
http://premium.working-money.com/wm/display.asp?art=344

AMIBroker forumula on Traders.com
http://www.traders.com/Documentation/FEEDbk_docs/Archive/022003/TradersTips/TradersTips.html

Z-Score in Wikipedia
http://en.wikipedia.org/wiki/Standard_score
-------------------------------------------------------------*/

periods = Param( "Period", 20, 1,3, 1);

ZScore = ( Close - MA( Close, periods ) ) / StDev( Close, periods );

Plot(ZScore, "Z-Score", colorDarkGrey );
Plot(2, "2", colorBlueGrey);
Plot(0, "0", colorBlueGrey );
Plot(-2, "-2", colorBlueGrey);

//3 Gradient Color

_SECTION_BEGIN("3 color gradient");

priceAxesWidth=0;
dateAxesHeight=0;
TitleHeight=0;

pxwidth = Status("pxwidth");
pxheight = Status("pxheight");

chartwidth = pxwidth-priceAxesWidth;
chartheight = pxheight-dateAxesHeight;

topColor=ParamColor("topColor",ColorRGB(207,254,240) );
centerColor=ParamColor("centerColor", ColorRGB(249,236,164));
botColor=ParamColor("BottomColor", ColorRGB( 253,223,196));
priceAxesColor=ParamColor("priceAxesColor", colorWhite );
dateAxesColor=ParamColor("dateAxesColor", colorWhite);

relPos=Param("centerPosition%",50,0,100,1)/100;
centerHeight=chartheight*Param("centerHeight%",10,0,100,1)/100;
x0=0;
y0=Max(TitleHeight,chartheight*relPos-centerHeight/2);
x1=chartwidth;
y1=Min(chartheight,chartheight*relPos+centerHeight/2);

GfxSetBkMode( 1 );
GfxSetOverlayMode(1);
GfxGradientRect(0,0,chartwidth,TitleHeight, colorWhite ,colorWhite);
GfxGradientRect(chartwidth,0,pxwidth,pxheight, priceAxesColor
,priceAxesColor);
GfxGradientRect(0,chartheight,chartwidth,pxheight, dateAxesColor
,dateAxesColor);
GfxGradientRect(x0,y0,x1,y1, CenterColor ,CenterColor );
GfxGradientRect(0,TitleHeight,chartwidth, y0,topColor, CenterColor );
GfxGradientRect(0,y1,chartwidth, chartheight,  CenterColor ,botColor);

_SECTION_END();

_SECTION_BEGIN("STANDARD DEVIATION MOVE");

stmove=(C-MA(C,20))/StDev(C,20);

Plot(stmove,"Standard Deviation Move",colorBlue,styleHistogram);
Plot(1,"",colorRed,styleLine);
Plot(-1,"",colorRed,styleLine);
_SECTION_END();

/*-----------------------------------------------------------
MTR Investors Group - www.MTRIG.com

Statistical Z-Score Indicator: Tracks how many standard
deviations the price is from the mean.

For more information on this indicator see the links below.

MTRIG - Reference
http://blog.mtrig.com/mtrig/blog/page/Z-Score-Indicator.aspx

Z-Score Trader's Notebook Article
http://premium.working-money.com/wm/display.asp?art=344

AMIBroker forumula on Traders.com
http://www.traders.com/Documentation/FEEDbk_docs/Archive/022003/TradersTips/TradersTips.html

Z-Score in Wikipedia
http://en.wikipedia.org/wiki/Standard_score
-------------------------------------------------------------*/

periods = Param( "Period", 20, 1,3, 1);

ZScore = ( Close - MA( Close, periods ) ) / StDev( Close, periods );

Plot(ZScore, "Z-Score", colorDarkGrey );
Plot(2, "2", colorBlueGrey);
Plot(0, "0", colorBlueGrey );
Plot(-2, "-2", colorBlueGrey);

//3 Gradient Color

_SECTION_BEGIN("3 color gradient");

priceAxesWidth=0;
dateAxesHeight=0;
TitleHeight=0;

pxwidth = Status("pxwidth");
pxheight = Status("pxheight");

chartwidth = pxwidth-priceAxesWidth;
chartheight = pxheight-dateAxesHeight;

topColor=ParamColor("topColor",ColorRGB(207,254,240) );
centerColor=ParamColor("centerColor", ColorRGB(249,236,164));
botColor=ParamColor("BottomColor", ColorRGB( 253,223,196));
priceAxesColor=ParamColor("priceAxesColor", colorWhite );
dateAxesColor=ParamColor("dateAxesColor", colorWhite);

relPos=Param("centerPosition%",50,0,100,1)/100;
centerHeight=chartheight*Param("centerHeight%",10,0,100,1)/100;
x0=0;
y0=Max(TitleHeight,chartheight*relPos-centerHeight/2);
x1=chartwidth;
y1=Min(chartheight,chartheight*relPos+centerHeight/2);

GfxSetBkMode( 1 );
GfxSetOverlayMode(1);
GfxGradientRect(0,0,chartwidth,TitleHeight, colorWhite ,colorWhite);
GfxGradientRect(chartwidth,0,pxwidth,pxheight, priceAxesColor
,priceAxesColor);
GfxGradientRect(0,chartheight,chartwidth,pxheight, dateAxesColor
,dateAxesColor);
GfxGradientRect(x0,y0,x1,y1, CenterColor ,CenterColor );
GfxGradientRect(0,TitleHeight,chartwidth, y0,topColor, CenterColor );
GfxGradientRect(0,y1,chartwidth, chartheight,  CenterColor ,botColor);

_SECTION_END();
2 comments
Leave Comment
Please login here to leave a comment.
Back
Thank you Classy bhai. :-p
can you pls post the support and resistance indicator on the price chart.
Thanks in advance