Stock Portfolio Organizer
The ultimate porfolio management solution.
Shares, Margin, CFD's, Futures and Forex
EOD and Realtime
Dividends and Trust Distributions
And Much More ....
WiseTrader Toolbox
#1 Selling Amibroker Plugin featuring:
Advanced Adaptive Indicators
Advanced Pattern Exploration
Neural Networks
And Much More ....
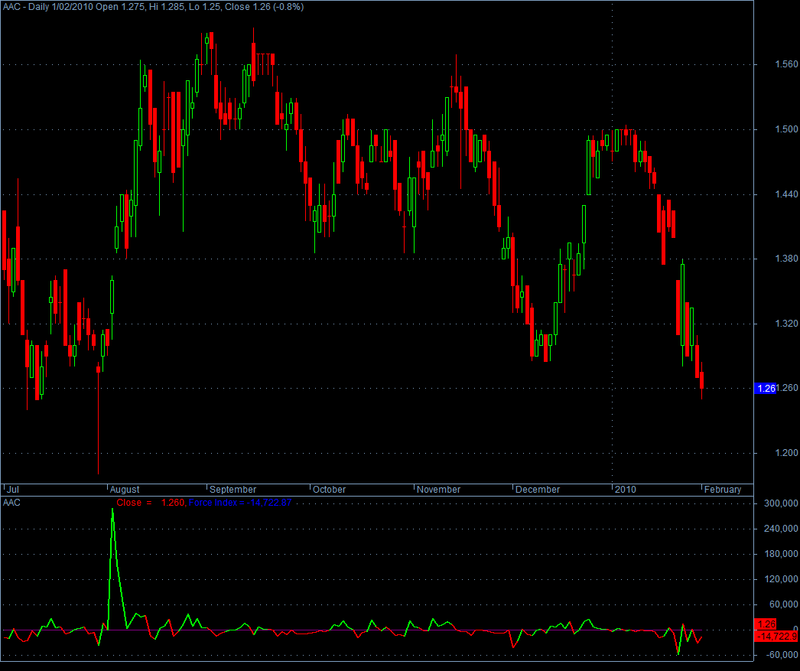
Force Index for Amibroker (AFL)
Rating:
5 / 5 (Votes 2)
Tags:
This is the Force index indicator.
Screenshots
Indicator / Formula
Copy & Paste Friendly
_SECTION_BEGIN("Force Index");
periods = Param("Periods", 2, 1, 100, 1);
FI = EMA(((Close - Ref(Close, -1)) * V), periods);
FI_kol = IIf(fi < 0, colorRed, colorBrightGreen);
Plot(Close, "Close", colorRed, 2);
Plot(FI, "Force Index", FI_kol, styleLine|styleThick);
Plot(0,"", colorViolet, styleLine | styleThick | styleNoLabel);
Title = Name() +
EncodeColor(colorBlack) + " - Force Index - " + WriteVal(periods, 1) + " days," +
EncodeColor(colorRed) + " Close " +
EncodeColor(colorRed) + " = " + WriteVal(Close) + ", " +
EncodeColor(colorBlue) + "Force Index = " +
EncodeColor(colorBlue) + WriteVal(FI, 1.2);
_SECTION_END();
1 comments
Leave Comment
Please login here to leave a comment.
Back
Nice one, thank you.
Just that you have used EMA of Change(close) instead of SMA. Stockcharts uses EMA too. While trading view uses SMA. Guess its just trader’s personal choice.