Stock Portfolio Organizer
The ultimate porfolio management solution.
Shares, Margin, CFD's, Futures and Forex
EOD and Realtime
Dividends and Trust Distributions
And Much More ....
WiseTrader Toolbox
#1 Selling Amibroker Plugin featuring:
Advanced Adaptive Indicators
Advanced Pattern Exploration
Neural Networks
And Much More ....
RAJASWAMY MULTI PIVIOT INTRADAY for Amibroker (AFL)
Rating:
3 / 5 (Votes 6)
Tags:
amibroker, pivot
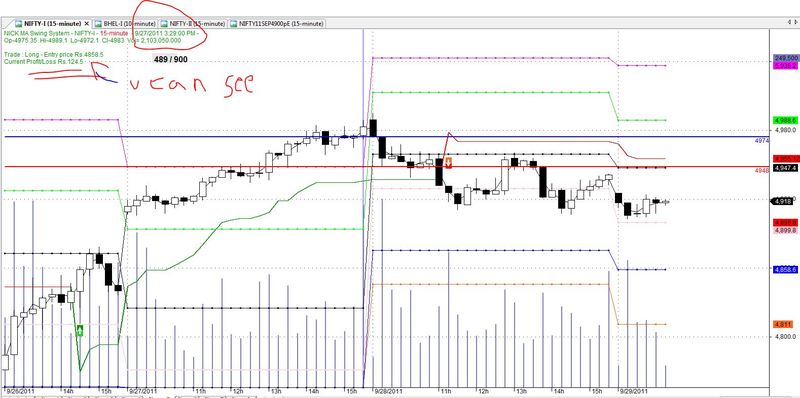
THIS PIVIOT SPECIALY DESINED FOR INTRADAY TRADING IN NIFTY
FOR FURTHER DETAILS PLS ASK ME
//= RAJASWAMY MULTI PIVIOT INTRADAY ====//
Screenshots
Similar Indicators / Formulas
Previous Pivots
Submitted
by Divyesh about 11 years ago
CAMARILLA hour -15min
Submitted
by berusnet about 13 years ago
PIVOT+CDP+3LevelPrice
Submitted
by eclife about 13 years ago
Pivot Breakout System
Submitted
by iris1in over 10 years ago
Woodies Pivot
Submitted
by Divyesh almost 12 years ago
NIFTYTIGER CAMARILLA LEVELS
Submitted
by niftytiger almost 12 years ago
Indicator / Formula
Copy & Paste Friendly
_SECTION_BEGIN

("HA");

//2 - IN - 1 PRICE CHART

Pstyle =

ParamToggle("Heikin Ashi","On|Off",1);

if


(Pstyle==0){

HaClose = (O+H+L+C)/

4;

HaOpen =

AMA( Ref( HaClose, -1 ), 0.5 );

HaHigh =

Max( H, Max( HaClose, HaOpen ) );

HaLow =

Min( L, Min( HaClose, HaOpen ) );

PlotOHLC

(HaOpen,HaHigh,HaLow,HaClose,"",IIf(HaClose >

HaOpen,colorGreen,colorBrown),styleCandle);


_N

(Title = StrFormat(

"{{NAME}} - {{INTERVAL}} {{DATE}} Open %g, Hi %g, Lo %g,


Close

%g (%.1f%%) {{VALUES}}", O, H, L, C, SelectedValue( ROC( C, 1 ) ) ));

}

else


{

_N

(Title = StrFormat(

"{{NAME}} - {{INTERVAL}} {{DATE}} Open %g, Hi %g, Lo %g,


Close

%g (%.1f%%) {{VALUES}}", O, H, L, C, SelectedValue( ROC( C, 1 ) ) ));

Plot

( C, "Close", ParamColor("Color", colorBlack ), styleNoTitle |

ParamStyle

("Style") | GetPriceStyle() );

}


//TIME FRAME CALCULATION

H1 =

TimeFrameGetPrice("H", inDaily, -1); // yesterdays high

L1 =

TimeFrameGetPrice("L", inDaily, -1); // low

C1=

TimeFrameGetPrice("C", inDaily, -1); // close

DayO =

TimeFrameGetPrice("O", inDaily); // current day open


// PIVOT Calculation

P = ( H1+ L1 + C1 )/

3;

S1 = (

2*P)-H1;

R1 = (

2*P)-L1;

S2 = P -(H1 - L1);

S3 = S1 - (H1-L1);

R2 = P +(H1 - L1);

R3 = R1 +(H1-L1);

// PIVOT mid points

MIDR1 = (P+R1)/

2;

MIDR2 = (R1+R2)/

2;

MIDR3 = (R2+R3)/

2;

MIDS1 = (P+S1)/

2;

MIDS2 = (S1+S2)/

2;

MIDS3 = (S2+S3)/

2;

//PLOTS

Plot

(R1, "",colorBrightGreen,styleDots+styleNoRescale);

Plot

(R2, "",colorCustom12,styleDots);

Plot

(S1, "",colorPink,styleDots+styleNoRescale);

Plot

(S1, "",colorRed,styleDots+styleNoRescale);

Plot

(S2, "",colorBlue,styleDots+styleNoRescale);

Plot

(S3, "",colorOrange,styleDots+styleNoRescale);

Plot

(P, "",colorBlack,styleDots+styleNoRescale);

// text section

"HIGH /LOW /CLOSE = "

+H +" / "+ L+" / "+ C +"\n";

"H1 /L1 /C1 = "

+H1 +" / "+ L1+" / "+ C1 +"\n";

"R3 = "

+R3;

"midr3 = "

+MIDR3;

"R2 = "

+R2;

"midr2 = "

+MIDR2;

"R1 = "

+R1;

"midr1 = "

+MIDR1;

"*************"

;

"p = "

+p;

"*************"

;

"mids1 = "

+MIDS1;

"S1 = "

+S1;

"mids2 = "

+MIDS2;

"S2 = "

+S2;

"mids3 = "

+MIDS3;

"S3 = "

+S3;

_SECTION_END

();

//Topping Bar

//Range = H - L ;

//TPB = Volume > MA(Volume,9) AND Close < Low + Range/2 AND Range <= Ref(Range,-1);

//PlotShapes(shapeSmallCircle * TPB,colorYellow,0,H,20);


//======================================================= SWING TRADE ==============================

_SECTION_BEGIN("NICK MA Swing");
SetBarsRequired(200,0);

GraphXSpace = 5;
SetChartOptions(0,chartShowArrows|chartShowDates);
k =  Optimize("K",Param("K",1,0.25,5,0.25),0.25,5,0.25);
Per= Optimize("atr",Param("atr",4,3,20,1),3,20,1);
HACLOSE=(O+H+L+C)/4;
HaOpen = AMA( Ref( HaClose,  -1 ),  0.5 );
HaHigh = Max( H,  Max( HaClose,  HaOpen ) );
HaLow = Min( L,  Min( HaClose,  HaOpen ) );
PlotOHLC( HaOpen, HaHigh, HaLow, HaClose, "" + Name(), colorBlack, styleLine | styleNoLabel );
j=Haclose;

//=======================================================================================================================
//=========================Indicator==============================================================================================
f=ATR(14);

rfsctor = WMA(H-L, Per);

revers = k * rfsctor;

Trend = 1;
NW[0] = 0;


for(i = 1; i < BarCount; i++)
{
 if(Trend[i-1] == 1)
 {
  if(j[i] < NW[i-1])
  {
   Trend[i] = -1;
   NW[i] = j[i] + Revers[i];
  }
  else
  {
   Trend[i] = 1;
   if((j[i] - Revers[i]) > NW[i-1])
   {
    NW[i] = j[i] - Revers[i];
   }
   else
   {
    NW[i] = NW[i-1];
   }
  }
 }
 if(Trend[i-1] == -1)
 {
  if(j[i] > NW[i-1])
  {
   Trend[i] = 1;
   NW[i] = j[i] - Revers[i];
  }
  else
  {
   Trend[i] = -1;
   if((j[i] + Revers[i]) < NW[i-1])
   {
    NW[i] = j[i] + Revers[i];
   }
   else
   {
    NW[i] = NW[i-1];
   }
  }
 }
}

//===============system================

Plot(NW, "", IIf(Trend == 1, 27, 4), 4);
Buy=Cover=Cross(j,nw);
Sell=Short=Cross(nw,j);
SellPrice=ValueWhen(Sell,C,1);
BuyPrice=ValueWhen(Buy,C,1);
Long=Flip(Buy,Sell);
Shrt=Flip(Sell,Buy );
_SECTION_END();
//=================TITLE================================================================================================
_SECTION_BEGIN("Title");
if( Status("action") == actionIndicator )
(
Title = EncodeColor(colorGreen)+ "NICK MA Swing System" + " - " +  Name() + " - " + EncodeColor(colorRed)+ Interval(2) + EncodeColor(colorGreen) +
 "  - " + Date() +" - "+"\n" +EncodeColor(colorGreen) +"Op-"+O+"  "+"Hi-"+H+"  "+"Lo-"+L+"  "+
"Cl-"+C+"  "+ "Vol= "+ WriteVal(V)+"\n"+
EncodeColor(colorLime)+
WriteIf (Buy , " GO LONG / Reverse Signal at "+C+"  ","")+
WriteIf (Sell , " EXIT LONG / Reverse Signal at "+C+"  ","")+"\n"+EncodeColor(colorGreen)+
WriteIf(Sell , "Total Profit/Loss for the Last Trade Rs."+(C-BuyPrice)+"","")+
WriteIf(Buy  , "Total Profit/Loss for the Last trade Rs."+(SellPrice-C)+"","")+
WriteIf(Long AND NOT Buy, "Trade : Long - Entry price Rs."+(BuyPrice),"")+
WriteIf(shrt AND NOT Sell, "Trade : Short - Entry price Rs."+(SellPrice),"")+"\n"+
WriteIf(Long AND NOT Buy, "Current Profit/Loss Rs."+(C-BuyPrice)+"","")+
WriteIf(shrt AND NOT Sell, "Current Profit/Loss Rs."+(SellPrice-C)+"",""));
PlotShapes(IIf(Buy, shapeSquare, shapeNone),colorGreen, 0, L, Offset=-40);
PlotShapes(IIf(Buy, shapeSquare, shapeNone),colorLime, 0,L, Offset=-50);
PlotShapes(IIf(Buy, shapeUpArrow, shapeNone),colorWhite, 0,L, Offset=-45);
PlotShapes(IIf(Sell, shapeSquare, shapeNone),colorRed, 0, H, Offset=40);
PlotShapes(IIf(Sell, shapeSquare, shapeNone),colorOrange, 0,H, Offset=50);
PlotShapes(IIf(Sell, shapeDownArrow, shapeNone),colorWhite, 0,H, Offset=-45);
_SECTION_END();

_SECTION_BEGIN("Time Left");
function GetSecondNum()
{
Time = Now( 4 );
Seconds = int( Time % 100 );
Minutes = int( Time / 100 % 100 );
Hours = int( Time / 10000 % 100 );
SecondNum = int( Hours * 60 * 60 + Minutes * 60 + Seconds );
return SecondNum;
}
RequestTimedRefresh( 1 );
TimeFrame = Interval();
SecNumber = GetSecondNum();
Newperiod = SecNumber % TimeFrame == 0;
SecsLeft = SecNumber - int( SecNumber / TimeFrame ) * TimeFrame;
SecsToGo = TimeFrame - SecsLeft;

x=Param("xposn",300,0,1000,1);
y=Param("yposn",50,0,1000,1);

GfxSelectSolidBrush( ColorRGB( 230, 230, 230 ) );
GfxSelectPen( ColorRGB( 230, 230, 230 ), 2 );
if ( NewPeriod )
{
GfxSelectSolidBrush( colorYellow );
GfxSelectPen( colorYellow, 2 );
Say( "New period" );
}
GfxRoundRect( x+45, y+17, x-3, y-2, 0, 0 );
GfxSetBkMode(1);
GfxSelectFont( "Arial", 12, 700, False );
GfxSetTextColor( colorBlack );
GfxTextOut( ""+SecsToGo+" / "+NumToStr( TimeFrame, 1.0 ), x, y );
_SECTION_END();


_SECTION_BEGIN("Volume");
Plot( Volume, _DEFAULT_NAME(), ParamColor("Color", colorBlueGrey ), ParamStyle( "Style", styleHistogram | styleOwnScale | styleThick, maskHistogram  ), 2 );
_SECTION_END();
8 comments
Leave Comment
Please login here to leave a comment.
Back
good one
Sir can you please explain how to fix the targets and also let me know the best time frame for intraday trades in nifty future.
sir its not showing anything, everything is blank,
its a blank chart
kindly help.
even it same for other of ur formuale
think it needs sme setting to b done
plz help
Well Done.Keep it up. Thanks.
excellent formula too good
Hi RAJASWAMY,
Really nice work. I like the idea to use HA for triggering but real candles for close price. I did something similar with the ATR based trigger line to go long/short. I thought thats more or less called SuperTend formula. Unfortunately I haven’t found any settings (parameter) to make the system profitable. I tried your system on several time basis (1min, 5min, 15min etc) but also couldn’t find a reasonable setting (have not use Pivots). I guess I have to use some pre filter etc here also.
Have you found some settings or additional filters to make the code profitable? Thanks for Help.
Regards,
Bernd :-)
Very good work!!!
Can i have your email id? I want some pivot afl changes or contact me asap on saeeavinash@gmail.com