Stock Portfolio Organizer
The ultimate porfolio management solution.
Shares, Margin, CFD's, Futures and Forex
EOD and Realtime
Dividends and Trust Distributions
And Much More ....
WiseTrader Toolbox
#1 Selling Amibroker Plugin featuring:
Advanced Adaptive Indicators
Advanced Pattern Exploration
Neural Networks
And Much More ....
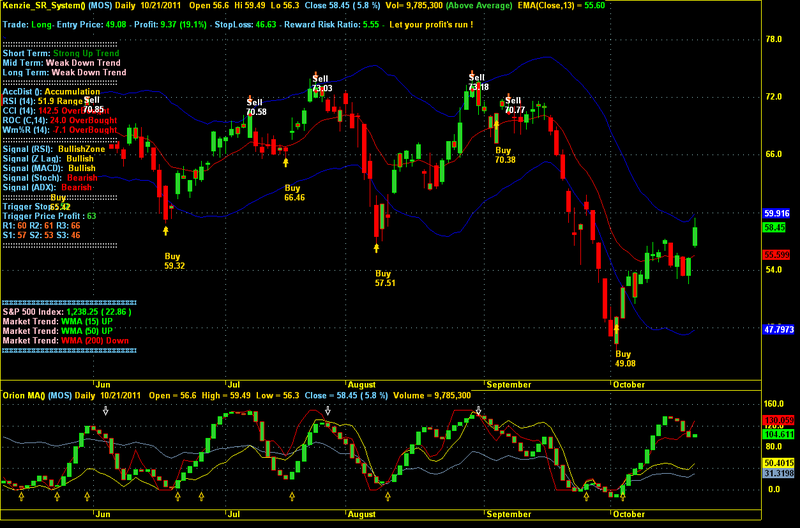
Kenzie_Enhanced for Amibroker (AFL)
Rating:
4 / 5 (Votes 16)
Tags:
amibroker, trading system, pivots
Buy and sell system with user selectable parameters combined with Orion confirming indicator…..
Screenshots
Similar Indicators / Formulas
Peak & Valley
Submitted
by mahesh.aranake over 13 years ago
MPLite--KAKA & Heinkin Ashi & NickMA
Submitted
by pharaoh over 13 years ago
CAMARILLA S1-R1 (tiger)
Submitted
by tigernifty over 12 years ago
Lakshmi buy sell signals
Submitted
by rani over 13 years ago
Isfandi Trading System II
Submitted
by isfandi about 13 years ago
Kenzie_SR_Modified
Submitted
by vargasc1 over 12 years ago
Indicator / Formula
Copy & Paste Friendly
//--------------------------------------------------------------//
//  Kenzie SR System - 09/2010
//  Modified By Kenzie Sebastian (kenziesr@yahoo.co.id)
//  Modified By vargaso_s@yahoo.com 10_21_2011
//
// - fixed the % change to display correctly
// - modified buy/sell signals display above/below candles
// - added Market trend S&P 500
// - change color of characters to display with black background.
// - added user selectable paramerers for lookback and display buy/sell
// - added confirming Orion MA() indicator
//--------------------------------------------------------------
SetBarsRequired( 800, 0 );

GraphXSpace = 7;
SetChartOptions( 0, chartShowArrows | chartShowDates );

// set criteria to scan for big stock only;
BigStock = MA( V, 2 ) * MA( C, 2 ) > 100000;

//---------------Color------------------------
per1 = 6;
per2 = 2;
Om = MA( O, per1 );
hm = MA( H, per1 );
lm = MA( L, per1 );
Cm = MA( C, per1 );

// 1. Heiken Ashi
HACLOSE = ( Om + Hm + Lm + Cm ) / 4;
HaOpen = AMA( Ref( HaClose,  -1 ),  0.5 );
HaHigh = Max( Hm,  Max( HaClose,  HaOpen ) );
HaLow = Min( Lm,  Min( HaClose,  HaOpen ) );


Of = MA( Haopen, per2 );
Cf = MA( Haclose, per2 );
Lf = IIf( haOpen < haClose, MA( Halow, per2 ), MA( Hahigh, per2 ) );
Hf = IIf( haOpen < haClose, MA( Hahigh, per2 ), MA( Halow, per2 ) );
//Color = IIf( Cf > Of, colorGreen, colorRed );


//----------------------------------------------------

TrailStop = HHV( C - 2 * ATR( 10 ), 15 );
ProfitTaker = EMA( H, 13 ) + 2 * ATR( 10 );
//ProfitTaker = BuyPrice - SellPrice;
/* **********************************
Code to automatically identify pivots
********************************** */

// -- what will be our lookback range for the hh and ll?
farback = 140; //How Far back to go
//nBars = 12; //Number of bars
nBars = Param("Look Back nBars", 4, 2, 200, 1 ); //Number of bars


// -- Create 0-initialized arrays the size of barcount
aHPivs = H - H;
aLPivs = L - L;

// -- More for future use, not necessary for basic plotting
aHPivHighs = H - H;
aLPivLows = L - L;
aHPivIdxs = H - H;
aLPivIdxs = L - L;
nHPivs = 0;
nLPivs = 0;
lastHPIdx = 0;
lastLPIdx = 0;
lastHPH = 0;
lastLPL = 0;
curPivBarIdx = 0;

// -- looking back from the current bar, how many bars
// back were the hhv and llv values of the previous
// n bars, etc.?
aHHVBars = HHVBars( H, nBars );
aLLVBars = LLVBars( L, nBars );
aHHV = HHV( H, nBars );
aLLV = LLV( L, nBars );

// -- Would like to set this up so pivots are calculated back from
// last visible bar to make it easy to "go back" and see the pivots
// this code would find. However, the first instance of
// _Trace output will show a value of 0
aVisBars = Status( "barvisible" );
nLastVisBar = LastValue( Highest( IIf( aVisBars, BarIndex(), 0 ) ) );
_TRACE( "Last visible bar: " + nLastVisBar );

// -- Initialize value of curTrend
curBar = ( BarCount - 1 );
curTrend = "";

if ( aLLVBars[curBar] < aHHVBars[curBar] )
{
    curTrend = "D";
}
else
{
    curTrend = "U";
}

// -- Loop through bars. Search for
// entirely array-based approach
// in future version
for ( i = 0; i < BarCount; i++ )
{
    curBar = ( BarCount - 1 ) - i;
// -- Have we identified a pivot? If trend is down...

    if ( aLLVBars[curBar] < aHHVBars[curBar] )
    {
// ... and had been up, this is a trend change
        if ( curTrend == "U" )
        {
            curTrend = "D";
// -- Capture pivot information
            curPivBarIdx = curBar - aLLVBars[curBar];
            aLPivs[curPivBarIdx] = 1;
            aLPivLows[nLPivs] = L[curPivBarIdx];
            aLPivIdxs[nLPivs] = curPivBarIdx;
            nLPivs++;
        }

// -- or current trend is up
    }
    else
    {
        if ( curTrend == "D" )
        {
            curTrend = "U";
            curPivBarIdx = curBar - aHHVBars[curBar];
            aHPivs[curPivBarIdx] = 1;
            aHPivHighs[nHPivs] = H[curPivBarIdx];
            aHPivIdxs[nHPivs] = curPivBarIdx;
            nHPivs++;
        }

// -- If curTrend is up...else...
    }

// -- loop through bars
}

// -- Basic attempt to add a pivot this logic may have missed
// -- OK, now I want to look at last two pivots. If the most
// recent low pivot is after the last high, I could
// still have a high pivot that I didn't catch
// -- Start at last bar
curBar = ( BarCount - 1 );

candIdx = 0;

candPrc = 0;

lastLPIdx = aLPivIdxs[0];

lastLPL = aLPivLows[0];

lastHPIdx = aHPivIdxs[0];

lastHPH = aHPivHighs[0];

if ( lastLPIdx > lastHPIdx )
{
// -- Bar and price info for candidate pivot
    candIdx = curBar - aHHVBars[curBar];
    candPrc = aHHV[curBar];

    if (
        lastHPH < candPrc AND
        candIdx > lastLPIdx AND
        candIdx < curBar )
    {
// -- OK, we'll add this as a pivot...
        aHPivs[candIdx] = 1;
// ...and then rearrange elements in the
// pivot information arrays

        for ( j = 0; j < nHPivs; j++ )
        {
            aHPivHighs[nHPivs-j] = aHPivHighs[nHPivs- ( j+1 )];
            aHPivIdxs[nHPivs-j] = aHPivIdxs[nHPivs-( j+1 )];
        }

        aHPivHighs[0] = candPrc ;

        aHPivIdxs[0] = candIdx;
        nHPivs++;
    }
}
else
{
// -- Bar and price info for candidate pivot
    candIdx = curBar - aLLVBars[curBar];
    candPrc = aLLV[curBar];

    if (
        lastLPL > candPrc AND
        candIdx > lastHPIdx AND
        candIdx < curBar )
    {
// -- OK, we'll add this as a pivot...
        aLPivs[candIdx] = 1;
// ...and then rearrange elements in the
// pivot information arrays

        for ( j = 0; j < nLPivs; j++ )
        {
            aLPivLows[nLPivs-j] = aLPivLows[nLPivs-( j+1 )];
            aLPivIdxs[nLPivs-j] = aLPivIdxs[nLPivs-( j+1 )];
        }

        aLPivLows[0] = candPrc;

        aLPivIdxs[0] = candIdx;
        nLPivs++;
    }
}

//============== EXPLORATION ==============
Buy = Cover = BigStock AND aLPivs == 1;

Sell = Short = BigStock AND aHPivs == 1;

SellPrice = ValueWhen( Sell, C, 1 );

BuyPrice = ValueWhen( Buy, C, 1 );

Long = Flip( Buy, Sell );

Shrt = Flip( Sell, Buy );

//==============Zero Lag TMA ==============
function ZeroLagTEMA( array, period )
{
    TMA1 = TEMA( array, period );
    TMA2 = TEMA( TMA1, period );
    Diff = TMA1 - TMA2;
    return TMA1 + Diff ;
}

haClose = ( haClose + haOpen + haHigh + haLow ) / 4;

periodtm = 55;
ZLHa = ZeroLagTEMA( haClose, periodtm );
ZLTyp = ZeroLagTEMA( Avg, periodtm );
TMBuy = Cross( ZLTyp, ZLHa );
TMSell = Cross( ZLHa, ZLTyp );
TMBuy1 = ZLTyp > ZLHa ;
TMSell1 = ZLHa > ZLTyp ;
//============== Plot price for Buy/Sell ==============
//n = 15;
 n = Param("Buy/Sell Chart Display", 5, 2, 200, 1 );
// a = C > Cross( ZLTyp, ZLHa );
 //b = C < Cross( ZLHa, ZLTyp );
a =  C > ( ZerolagTEMA( haHigh, n ) + ZerolagTEMA( haLow, n ) ) / 2;// then Buy next bar at market;

b = C < ( ZerolagTEMA( haHigh, n ) + ZerolagTEMA(haLow, n ) ) / 2;// then Sell Short next bar at market;

state = IIf( BarsSince( a ) < BarsSince( b ), 1, 0 );

Longs = state == 1;

shorts = state == 0;

//Chart
Colorbar = IIf( Longs, colorBrightGreen, IIf( Shorts, colorRed, colorGrey40 ) );

Plot( C, "Close", colorbar, styleCandle = 64 | styleNoTitle );

//============== Plot Shape ==============
PlotShapes( IIf( aHPivs == 1, shapeDownArrow, shapeNone ), colorOrange, 0, SellPrice +  .4 );

PlotShapes( IIf( aLPivs == 1, shapeUpArrow , shapeNone ), colorGold, 0, BuyPrice - .5 );
PlotShapes( IIf(Buy, shapeSmallCircle, shapeNone),colorGold, 0, BuyPrice - .2 );
PlotShapes( IIf(Sell, shapeSmallCircle, shapeNone),colorRed, 0 ,SellPrice + .4 );
FirstVisibleBar = Status( "FirstVisibleBar" );
Lastvisiblebar = Status("LastVisibleBar");
for( b = Firstvisiblebar; b <= Lastvisiblebar AND b < BarCount; b++)
{
if( Buy[b] ) PlotText("\n\n\n\n Buy\n "+NumToStr(BuyPrice[b],1.2),b,BuyPrice[b] - .2,colorGold);
else if( Sell[b] ) PlotText("Sell\n"  +NumToStr(SellPrice[b], 1.2),b,SellPrice[b] +.6, colorWhite );
}

//============== EMA(13) ==============
Plot( EMA( C, 13 ), "" , colorSkyblue + styleThick + styleNoRescale );
//Color = ParamColor("Color", colorLightGrey );
//Style = ParamStyle("Style") | styleNoRescale;

//============== TRENDING ==============
DTL = 150; // DTL = Define Trend Long

DTM = 70;	// DTM = Define Trend Medium

DTS = 14;  // DTS = Define Trend Short

TL = LinRegSlope( MA( C, DTL ), 2 );	 // TL = Trend Long

TM = LinRegSlope( MA( C, DTM ), 2 );  // TM = Trend Medium

TS = LinRegSlope( MA( C, DTS ), 2 );  // TS = Trend Short

TLL = IIf( LinRegSlope( MA( C, DTL ), 2 ) > 0, True, False );

TMM = IIf( LinRegSlope( MA( C, DTM ), 2 ) > 0, True, False );

TSS = IIf( LinRegSlope( MA( C, DTS ), 2 ) > 0, True, False );

//============== VOLUME ==============
Vlp = 30; //Volume lookback period

Vrg = MA( V, Vlp );

St = StDev( Vrg, Vlp );

Vp3 = Vrg + 3 * st;

Vp2 = Vrg + 2 * st;

Vp1 = Vrg + 1 * st;

Vn1 = Vrg - 1 * st;

Vn2 = Vrg - 2 * st;

//============== WILLIAM'S %R ==============
WR = ( ( HHV( H, 14 ) - C ) / ( HHV ( H, 14 ) - LLV ( L, 14 ) ) ) * -100;

//============== A/D ==============
TRH = IIf( Ref( C, -1 ) > H, Ref( C, -1 ), H );

TRL = IIf( Ref( C, -1 ) < L, Ref( C, -1 ), L );

ad = IIf( C > Ref( C, -1 ), C - TRL, IIf( C < Ref( C, -1 ), C - TRH, 0 ) );

WAD = Cum( ad );

wu = wad > Ref( wad, -1 );

wd = wad < Ref( wad, -1 );

//============== MACD ==============
MB = Cross ( MACD(), Signal() );

MS = Cross( Signal(), MACD() );

MB = ExRem( MB, MS );

MS = ExRem( MS, MB );

MB1 = MACD() > Signal();

MS1 = MACD() < Signal();

//============== STOCH ==============
StochKval = StochK( 10, 5 );

StochDval = StochD( 10, 5, 5 );

StochBuy = Cross( StochK( 10, 5 ), StochD( 10, 5, 5 ) );

StochSell = Cross ( StochD( 10, 5, 5 ), StochK( 10, 5 ) );

StBuy = StochK( 10, 5 ) > StochD( 10, 5, 5 );

StSell = StochK( 10, 5 ) < StochD( 10, 5, 5 );

//============== ADX ==============
adxBuy =  Cross( PDI( 14 ), MDI( 14 ) );

adxSell = Cross( MDI( 14 ), PDI( 14 ) );

adxBuy = ExRem( adxBuy, adxSell );

adxSell = ExRem( adxSell, adxBuy );

adxbuy1 = PDI( 14 ) > MDI( 14 );

adxsell1 = MDI( 14 ) > PDI( 14 );


//============== ZLW ==============
R = ( ( HHV( H, 14 ) - C ) / ( HHV ( H, 14 ) - LLV ( L, 14 ) ) ) * -100;
MaxGraph = 10;
PeriodZ = 10;
EMA1 = EMA( R, PeriodZ );
EMA2 = EMA( EMA1, 5 );
Difference = EMA1 - EMA2;
ZeroLagEMA = EMA1 + Difference;
PR = 100 - abs( ZeroLagEMA );
MoveAvg = MA( PR, 5 );
ZBuy = Cross( PR, moveAvg ) AND PR < 30;
ZSell = Cross( moveAvg, PR ) AND PR > 70;
ZBuy1 = PR >= MoveAvg AND PR >= Ref( PR, -1 ) ;
ZSell1 = ( PR < MoveAvg ) OR PR >= MoveAvg AND PR < Ref( PR, -1 ) ;

//============== RS ==============
p = ( H + L + C ) / 3;
r1 = ( 2 * p ) - L;
s1 = ( 2 * p ) - H;
r2 = p + ( r1 - s1 );
s2 = p - ( r2 - s1 );
R3 = P + ( R2 - S2 );
S3 = P - ( R3 - S2 );

//============== IBUY ==============
Ibuy =  Cross( RSI( 14 ), EMA( RSI( 14 ), 9 ) );
Isell = Cross( EMA( RSI( 14 ), 9 ), RSI( 14 ) );
Ibuy = ExRem( Ibuy, ISell );
Isell = ExRem( ISell, Ibuy );
BlRSI = RSI( 14 ) > EMA( RSI( 14 ), 9 );
BrRSI = RSI( 14 ) < EMA( RSI( 14 ), 9 );


//=================Trend & Signals & Market Index ===============================
/// Please replace "^GSPC" with your market index ticker and activate the codes

/// Market Bull Bear

Cg = Foreign("^GSPC", "C");
Cgo= Ref(Cg,-1);

//Longterm Bullish or Bearish
Bullg = Cg > WMA(Cg,200);
Bearg= Cg <WMA(Cg,200);

//Midterm Bullish or Bearish
mBullg = Cg >WMA(Cg,50);
mBearg= Cg <WMA(Cg,50);

//Shortterm Bullish or Bearish
sBullg = Cg >WMA(Cg,15);
sBearg= Cg <WMA(Cg,15);
////////////////////////////////


xChange1=Cg - Ref(Cg,-1);
Change1 = StrFormat("%1.2f% ",xChange1);
barche1= xChange1>=0;
Comche1= xChange1<0;
xperchange1 = xChange1/100;
perchange1 = StrFormat("%1.2f% ",xperchange1);
positivechange1 = xperchange1>0;
negativechange1 = xperchange1<0;

//=================Trend & Signals & Market Index END===============================


//============== TITLE ==============
_SECTION_BEGIN( "" );
printf( "Open : " + O );

if ( Status( "action" ) == actionIndicator )
    (
        Title = EncodeColor( colorYellow )  + _DEFAULT_NAME()  + EncodeColor( ColorRGB( 111, 208, 255 ) )  + " (" +  Name() + ") " + EncodeColor( colorGold ) + Interval( 2 ) +
                "  " + Date() + " " + "  Open " + O + "  " + "Hi " +  H + "  " + "Lo " + L + "  " + EncodeColor( ColorRGB( 111, 208, 255 ) ) +
                "Close " + C + " ( " + WriteVal( ( C - Ref( C, -1 ) ) * 100 / Ref( C, -1 ), 1.1 ) + " %)" + EncodeColor( colorGold ) + "  Vol= " + WriteVal( V, 1.0 )
                + " " + WriteIf( V > Vp2, EncodeColor( colorBrightGreen ) + "(Very High)", WriteIf( V > Vp1, EncodeColor( colorLime ) + "(High)", WriteIf( V > Vrg, EncodeColor( colorLime ) + "(Above Average)",
                                 WriteIf( V<Vrg AND V>Vn1, EncodeColor( ColorRGB( 255, 0, 128 ) ) + "(Less than Average)", WriteIf( V < Vn1, "(Low)", "" ) ) ) ) ) + EncodeColor( colorGold ) + "  "
                + EncodeColor( colorGold ) + "EMA(Close,13) = " +EncodeColor( colorBrightGreen ) + WriteVal( EMA( C, 13 ), 1.2 )


                + "\n\n" + EncodeColor( ColorRGB( 111, 208, 255 ) ) +
                WriteIf ( Buy , "Signal: Go Long -" +EncodeColor( colorBrightGreen ) + " Entry Price: " + WriteVal( C, 1.2 ) + EncodeColor( ColorRGB( 111, 208, 255 ) ) +" - Last Exit Price: " +  EncodeColor( colorBrightGreen) +WriteVal( SellPrice, 1.2 )
                          + " (" + WriteVal( ( BuyPrice - SellPrice ), 1.2 ) + ")" + EncodeColor( ColorRGB( 111, 208, 255 ) ) +" - StopLoss: " + EncodeColor( colorBrightGreen ) + WriteVal( C * .95, 1.2 ) + EncodeColor( ColorRGB( 111, 208, 255 ) ) + " - Reward Risk Ratio: " + EncodeColor( colorBrightGreen) + WriteVal( ( profittaker - C ) / ( C - C * 0.95 ), 1.2 ) + " - " + EncodeColor( colorGold ) + "Strong Buy!"
                          , "" ) +

                EncodeColor( ColorRGB( 111, 208, 255 ) ) +
                WriteIf ( Sell , "Signal: Go Short -" + EncodeColor( colorBrightGreen ) +"Exit Price: " + WriteVal( C, 1.2 ) + EncodeColor( ColorRGB( 111, 208, 255 ) )  +
                " - Profit: " +  EncodeColor( colorBrightGreen ) + WriteVal( ( SellPrice - BuyPrice ), 1.2 ) + " (" + WriteVal( ( ( SellPrice - BuyPrice ) * 100 / BuyPrice ), 1.1 ) + "%)" + EncodeColor( colorGold ) + " - Profit Taking!", "" ) +
                EncodeColor( ColorRGB( 111, 208, 255 ) ) +
                WriteIf( Long AND NOT Buy, "Trade:"  + EncodeColor( colorBrightGreen) +" Long" + EncodeColor( ColorRGB( 111, 208, 255 ) )  +"- Entry Price: " + EncodeColor( colorBrightGreen) + WriteVal( ( BuyPrice ), 1.2 ) +EncodeColor( ColorRGB( 111, 208, 255 ) ) + " - Profit: " + EncodeColor( colorBrightGreen) + WriteVal( ( C - BuyPrice ), 1.2 ) + " (" + WriteVal( ( ( C - BuyPrice ) * 100 / BuyPrice ), 1.1 ) + "%)" +
                EncodeColor( ColorRGB( 111, 208, 255 ) ) + " - StopLoss: " + EncodeColor( colorBrightGreen) + WriteVal( ( BuyPrice * .95 ), 1.2 ) + EncodeColor( ColorRGB( 111, 208, 255 ) ) + " - Reward Risk Ratio: " + EncodeColor( colorBrightGreen) + WriteVal( ( profittaker - BuyPrice ) / ( BuyPrice - BuyPrice * 0.95 ), 1.2 ) + " - " + EncodeColor( colorGold ) + " Let your profit's run !", "" ) +
                WriteIf( shrt AND NOT Sell, "Trade: Short - Exit Price: " + WriteVal( ( SellPrice ), 1.2 ) + " - Profit: " + WriteVal( ( SellPrice - BuyPrice ), 1.2 ) + " (" + WriteVal( ( ( SellPrice - BuyPrice ) * 100 / BuyPrice ), 1.1 ) + "%) - " + EncodeColor( colorBrightGreen ) + "Watch for a Strong Buy Signal !", "" )

                + "\n\n" +  EncodeColor( colorLightGrey ) + ":::::::::::::::::::::::::::::::::::::::::::::"

                + "\n" + EncodeColor( ColorRGB( 111, 208, 255 ) ) + "Short Term: " +
                WriteIf( TS > 0 AND TS < 0.3, EncodeColor( colorLime ) + "Weak Up Trend",
                         WriteIf( TS >= 0.3 AND TS < 0.6 , EncodeColor( colorGold ) + "Medium Up Trend",
                                  WriteIf( TS >= 0.6, EncodeColor( colorGreen ) + "Strong Up Trend",
                                           WriteIf( TS<0 AND TS> -0.3, EncodeColor( colorPink ) + "Weak Down Trend",
                                                    WriteIf( TS <= -0.3 AND TS > -0.6 , EncodeColor( ColorRGB( 255, 0, 128 ) ) + "Medium Down Trend",
                                                             WriteIf( TS <= -0.6, EncodeColor( colorRed ) + "Strong Down Trend", EncodeColor( colorGold ) + "Sideways" ) ) ) ) ) )

                + "\n" + EncodeColor( ColorRGB( 111, 208, 255 ) ) + "Mid Term: " +
                WriteIf( TM > 0 AND TM < 0.3, EncodeColor( colorLime ) + "Weak Up Trend",
                         WriteIf( TM >= 0.3 AND TM < 0.6 , EncodeColor( colorGold ) + "Medium Up Trend",
                                  WriteIf( TM >= 0.6, EncodeColor( colorGreen ) + "Strong Up Trend",
                                           WriteIf( TM<0 AND TM> -0.3, EncodeColor( colorPink ) + "Weak Down Trend",
                                                    WriteIf( TM <= -0.3 AND TM > -0.6 , EncodeColor( ColorRGB( 255, 0, 128 ) ) + "Medium Down Trend",
                                                             WriteIf( TM <= -0.6, EncodeColor( colorRed ) + "Strong Down Trend", EncodeColor( colorGold ) + "Sideways" ) ) ) ) ) )

                + "\n" + EncodeColor( ColorRGB( 111, 208, 255 ) ) + "Long Term: " +
                WriteIf( TL > 0 AND TL < 0.3, EncodeColor( colorLime ) + "Weak Up Trend",
                         WriteIf( TL >= 0.3 AND TL < 0.6 , EncodeColor( colorGold ) + "Medium Up Trend",
                                  WriteIf( TL >= 0.6, EncodeColor( colorGreen ) + "Strong Up Trend",
                                           WriteIf( TL<0 AND TL> -0.3, EncodeColor( colorPink ) + "Weak Down Trend",
                                                    WriteIf( TL <= -0.3 AND TL > -0.6 , EncodeColor( ColorRGB( 255, 0, 128 ) ) + "Medium Down Trend",
                                                             WriteIf( TL <= -0.6, EncodeColor( colorRed ) + "Strong Down Trend", EncodeColor( colorGold ) + "Sideways" ) ) ) ) ) )

                + "\n" +  EncodeColor( colorLightGrey ) +":::::::::::::::::::::::::::::::::::::::::::::"


                + "\n" + EncodeColor( ColorRGB( 111, 208, 255 ) ) + "AccDist (): " + WriteIf( wu, EncodeColor( colorGold ) + "Accumulation", WriteIf( wd, EncodeColor( colorRed ) + "Distribution", "Neutral" ) )

                + "\n" + EncodeColor( ColorRGB( 111, 208, 255 ) ) + "RSI (14): " + WriteIf( RSI( 14 ) > 30 AND RSI( 14 ) < 70, EncodeColor( colorGold ), WriteIf( RSI( 14 ) < 30 , EncodeColor( colorBlue ), EncodeColor( colorRed ) ) ) + WriteVal( RSI( 14 ), format = 1.1 )
                + WriteIf( RSI( 14 ) > 30 AND RSI( 14 ) < 70, " Range" + EncodeColor( colorGold ), WriteIf( RSI( 14 ) < 30 , " OverSold" + EncodeColor( colorBlue ), " OverBought" + EncodeColor( colorRed ) ) )

                + "\n" + EncodeColor( ColorRGB( 111, 208, 255 ) ) + "CCI (14): " + WriteIf( CCI( 14 ) > -100 AND CCI( 14 ) < 100, EncodeColor( colorGold ), WriteIf( CCI( 14 ) < -100 , EncodeColor( colorBlue ), EncodeColor( colorRed ) ) ) + WriteVal( CCI( 14 ), format = 1.1 )
                + WriteIf( CCI( 14 ) > -100 AND CCI( 14 ) < 100, " Range" + EncodeColor( colorGold ), WriteIf( CCI( 14 ) < -100 , " OverSold" + EncodeColor( colorBlue ), " OverBought" + EncodeColor( colorRed ) ) )

                + "\n" + EncodeColor( ColorRGB( 111, 208, 255 ) ) + "ROC (C,14): " + WriteIf( ROC( C, 14 ) > -10 AND ROC( C, 14 ) < 10, EncodeColor( colorGold ), WriteIf( ROC( C, 14 ) < -10 , EncodeColor( colorBlue ), EncodeColor( colorRed ) ) ) + WriteVal( ROC( C, 14 ), format = 1.1 )
                + WriteIf( ROC( C, 14 ) > -10 AND ROC( C, 14 ) < 10, " Range" + EncodeColor( colorGold ), WriteIf( ROC( C, 14 ) < -10 , " OverSold" + EncodeColor( colorBlue ), " OverBought" + EncodeColor( colorRed ) ) )

                + "\n" + EncodeColor( ColorRGB( 111, 208, 255 ) ) + "Wm%R (14): " + WriteIf( WR > -80 AND WR < -20, EncodeColor( colorGold ), WriteIf( WR < -80 , EncodeColor( colorBlue ), EncodeColor( colorRed ) ) ) + WriteVal( WR, format = 1.1 )
                + WriteIf( WR > -80 AND WR < -20, " Range" + EncodeColor(colorGold ), WriteIf( WR < -80 , " OverSold" + EncodeColor( colorBlue ), " OverBought" + EncodeColor( colorRed ) ) )


                + "\n" +  EncodeColor( colorLightGrey ) +":::::::::::::::::::::::::::::::::::::::::::::"


                + "\n" + EncodeColor( ColorRGB( 111, 208, 255 ) ) + "Signal (RSI):  " + WriteIf( Ibuy, EncodeColor( colorGold) + "BuyWarning", WriteIf( Isell, EncodeColor( colorRed ) + "SellWarning", WriteIf( BlRSI, EncodeColor( colorGold ) + "BullishZone", WriteIf( BrRSI, EncodeColor( colorRed ) + "BearishZone", "Neutral" ) ) ) )

                + "\n" + EncodeColor( ColorRGB( 111, 208, 255 ) ) + "Signal (Z Lag):  " + WriteIf( TMBuy, EncodeColor(colorGold ) + "Buy", WriteIf( TMSell, EncodeColor( colorRed ) + "Sell", WriteIf( TMBuy1, EncodeColor( colorGold ) + "Bullish", WriteIf( TMSell1, EncodeColor( colorRed ) + "Bearish", "Neutral" ) ) ) )

                + "\n" + EncodeColor( ColorRGB( 111, 208, 255 ) ) + "Signal (MACD):  " + WriteIf( MB, EncodeColor( colorGold ) + "Buy", WriteIf( MS, EncodeColor( colorRed ) + "Sell", WriteIf( MB1, EncodeColor( colorGold ) + "Bullish", WriteIf( MS1, EncodeColor( colorRed ) + "Bearish", "Neutral" ) ) ) )

                + "\n" + EncodeColor( ColorRGB( 111, 208, 255 ) ) + "Signal (Stoch):  " + WriteIf( StochBuy, EncodeColor( colorGold ) + "Buy", WriteIf( StochSell, EncodeColor( colorRed ) + "Sell", WriteIf( StBuy, EncodeColor( colorGold ) + "Bullish", WriteIf( StSell, EncodeColor( colorRed ) + "Bearish", "Neutral" ) ) ) )

                + "\n" + EncodeColor( ColorRGB( 111, 208, 255 ) ) + "Signal (ADX):  " + WriteIf( adxBuy, EncodeColor( colorGold ) + "Buy", WriteIf( adxSell, EncodeColor( colorRed ) + "Sell", WriteIf( adxBuy1, EncodeColor( colorGold ) + "Bullish", WriteIf( adxSell1, EncodeColor( colorRed ) + "Bearish", "Neutral" ) ) ) )

                +  "\n" +  EncodeColor( colorLightGrey ) +":::::::::::::::::::::::::::::::::::::::::::::"


                + "\n" + EncodeColor( ColorRGB( 111, 208, 255 ) ) + "Trigger Stop : " + EncodeColor( colorLime ) + WriteVal( TrailStop, format = 1.0 )
                + "\n" + EncodeColor( ColorRGB( 111, 208, 255 ) ) + "Trigger Price Profit : " + EncodeColor( colorLime ) + WriteVal( Profittaker, format = 1.0 )
                + "\n" +EncodeColor( ColorRGB( 111, 208, 255 ) ) + "R1: " + EncodeColor( colorOrange ) + WriteVal( r1, format = 1.0 )
                + EncodeColor( ColorRGB( 111, 208, 255 ) ) + " R2: " + EncodeColor( colorOrange ) + WriteVal( r2, format = 1.0 )
                + EncodeColor( ColorRGB( 111, 208, 255 ) ) + " R3: " + EncodeColor( colorOrange ) + WriteVal( r3, format = 1.0 )
                + "\n" +EncodeColor( ColorRGB( 111, 208, 255 ) ) + "S1: " + EncodeColor( colorOrange ) + WriteVal( s1, format = 1.0 )
                + EncodeColor( ColorRGB( 111, 208, 255 ) ) + " S2: " + EncodeColor( colorOrange ) + WriteVal( s2, format = 1.0 )
                +EncodeColor( ColorRGB( 111, 208, 255 ) ) + " S3: " + EncodeColor( colorOrange ) + WriteVal( s3, format = 1.0 )

                +  "\n" +  EncodeColor( colorLightGrey ) + ":::::::::::::::::::::::::::::::::::::::::::::"


                + "\n\n\n\n\n\n" +  EncodeColor( ColorRGB( 111, 208, 255 ) ) + "¤¤¤¤¤¤¤¤¤¤¤¤¤¤¤¤¤¤¤¤¤¤¤¤¤¤¤¤¤¤"


                +"\n"+EncodeColor(colorPink)+"S&P 500 Index: "+ WriteIf(Cg>Cgo,EncodeColor(08),EncodeColor(04))+WriteVal(Cg,format=1.2)+WriteIf(positivechange1, EncodeColor(colorBrightGreen),"")+WriteIf(negativechange1,EncodeColor(colorRed), "")+" ( "+WriteIf(barche1,"\\c08"+Change1,"")+WriteIf(barche1,"\\c08 ","")+WriteIf(Comche1,"\\c04"+Change1,"")+ WriteIf(Comche1,"\\c04 ","")+""+") "

                +"\n"+EncodeColor(colorPink)+"Market Trend: "+ WriteIf(sBullg,EncodeColor(colorBrightGreen)+"WMA (15) UP",WriteIf(sBearg,EncodeColor(colorRed)+"WMA (15) Down",EncodeColor(colorYellow)+"WMA (15) Flat"))

                +"\n"+EncodeColor(colorPink)+"Market Trend: "+ WriteIf(mBullg,EncodeColor(colorBrightGreen)+"WMA (50) UP",WriteIf(mBearg,EncodeColor(colorRed)+"WMA (50) Down",EncodeColor(colorYellow)+"WMA (50) Flat"))

                + "\n"+EncodeColor(colorPink)+"Market Trend: " +WriteIf(Bullg,EncodeColor(colorBrightGreen)+"WMA (200) UP",WriteIf(Bearg,EncodeColor(colorRed)+"WMA (200) Down",EncodeColor(colorYellow)+"WMA (200) Flat"))

                + "\n" +  EncodeColor( ColorRGB( 111, 208, 255 ) ) + "¤¤¤¤¤¤¤¤¤¤¤¤¤¤¤¤¤¤¤¤¤¤¤¤¤¤¤¤¤¤"


                 );


//============== BACKGROUND NAME ==============

pxwidth = Status( "pxwidth" );

pxheight = Status( "pxheight" );

GfxSetOverlayMode( 1 );

GfxSetBkMode( 0 ); // transparent

GfxSelectFont( "Amienne", Status( "pxheight" ) / 15 );

//GfxSetTextColor( colorGrey40 );

//GfxTextOut( "Kenzie Sebastian", Status("pxwidth")/5.3, Status("pxheight")/5 );

//============================

////BACKGROUND COLOR////////////////////////////////////////////////////////
//SetChartBkColor(ColorRGB(255,200,255));
//SetChartBkGradientFill( colorPlum, colorPlum);
/////////////////////////////////////////////////////////////////////////////////////


_SECTION_END();

_SECTION_BEGIN( "Keltner Bands" );

P = ParamField( "Price field", -1 );

Periods = Param( "Periods", 15, 2, 300, 1 );

Width = Param( "Width", 2, 0, 10, 0.05 );

Color = ParamColor( "Color", colorBlue );

Style = ParamStyle( "Style" );

CenterLine = MA( P, Periods );

KTop   = CenterLine + Width * ATR( Periods );

KBot = CenterLine - Width * ATR( Periods );

Plot( KTop, "KBTop" + _PARAM_VALUES(), Color, Style );

Plot( KBot, "KBBot" + _PARAM_VALUES(), Color, Style );
_SECTION_END();
13 comments
Leave Comment
Please login here to leave a comment.
Back
Uses pivot point formula which is future looking so beware.
signal refers to future quotes. No modification done. posting again the same indicator. where is the orion indicator.
Dear Sir,
Can you please post the afl of ORION too.Thanks in advance.
24.10.2011
Hai! Vargaso,
Kindly post the the AFL with Orion included.
Best Regards,
Kartheek D. N.
Thanks Vargaso
Sharing for it.
It Will be very helpful if u post Orion AFL
I have a question. AMIBROKER 5.10 WITH NO causes the same Picture with the one above.
WAS DEVELOPED FOR AMIBROKER 5.30?
Orion code and plot missing.
Realized after posting Kenzie_Enhanced that the Orion
MA needed more work. I will post when completed.
Thnx “VARGASC1” will be waiting for orion wn ready…hope it be christmas gift from you
Thanks alot Vargasc1
Orion > indicator beautiful , waiting for Orion ready
Hi!. Where I could to read how to use Kenzie system. Thanks in advance…
Hi,
Thanks for sharing the AFL.
Its appearing great on the chart, needs to be studied whether signals are firm or change as time goes on.
Any one tested this. what is the TF ? Is it for 15 min or 1 hour for intraday trading
Viswanath
nice one