Stock Portfolio Organizer
The ultimate porfolio management solution.
Shares, Margin, CFD's, Futures and Forex
EOD and Realtime
Dividends and Trust Distributions
And Much More ....
WiseTrader Toolbox
#1 Selling Amibroker Plugin featuring:
Advanced Adaptive Indicators
Advanced Pattern Exploration
Neural Networks
And Much More ....
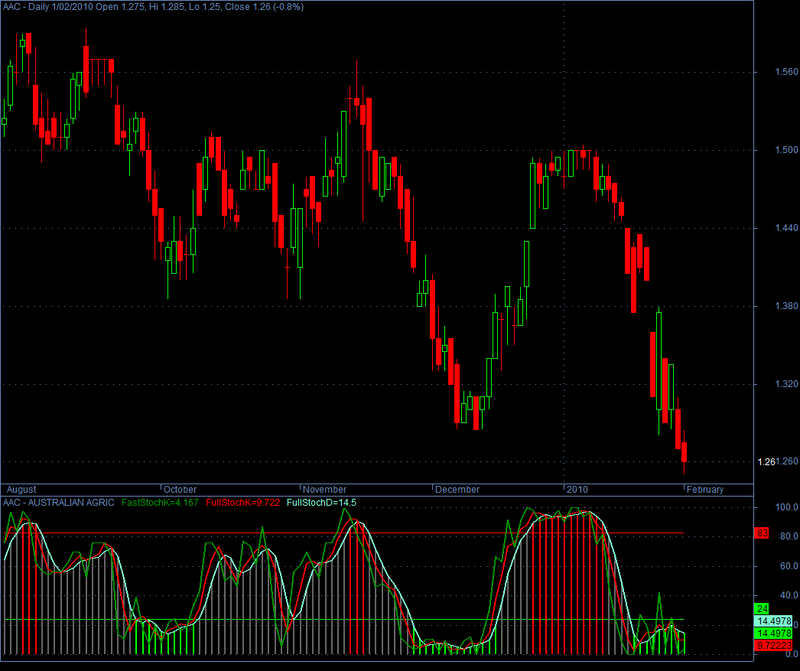
FastStochK FullStochK-D for Amibroker (AFL)
Rating:
5 / 5 (Votes 3)
Tags:
amibroker, osicllator
Just an enhancement to the display and control of colors.
Original Code By: Abdul Kareem
Screenshots
Indicator / Formula
Copy & Paste Friendly
//------------------------------------------------------------------------------
//
//  Just an enhacement to the display and control of colors.
//
//------------------------------------------------------------------------------

_SECTION_BEGIN("FastStoch FullStochK");
/*FastStoch%KFullStoch%K%D
Originally Developed by George C. Lane
Modified by Abdulkareem
For reference, see;
http://stockcharts.com/education/What/IndicatorAnalysis/indic_stochasticOscillator.html
or,
http://www.aspenres.com/Website/comstock/help/aspenStochastics.html
Values about at OR above the Red line show overbought,
AND about at OR below the Green line show oversold.
where x is the first parameter, y is the second parameter
and (in the case of Full stochastics), z is the third parameter.
 In the case of Fast and Slow Stochastics,
 x is typically 14 and y is usually set to 3.
 The formula could be plotted with three lines,
 Hence 14-3-3  or 14-5-3 or 14-3-5
%K (fast)
%K (full) = y-day SMA of %K (fast)
%D (full) = z-day SMA of %K (full)
or just the usual 2 lines,
%K (full) = y-day SMA of %K (fast)
%D (full) = z-day SMA of %K (full)
*/
pds = Param("Periods",13,2,20); /*Periods */
/*pds = Optimize("pds",13,2,20,1); */

slw = Param("Slow StochK",3,1,14); ; /*Slowing for Full Stoch%K*/
/*slw = Optimize("slw",3,1,14,1); */

slwd = Param("Slow StochD",3,1,14); /*Slowing for Full Stoch%D*/
/*slwd = Optimize("slwd",3,1,14,1); */

ob = Param("Overbought",83,65,88); /*Overbought */
/*ob = Optimize("ob",83,65,88,1); */

os = Param("Oversold",24,20,50); /*Oversold */
/*os = Optimize("os",24,20,50,1); */

FSK = 100*(C-LLV(L,pds))/(HHV(H,pds)-LLV(L,pds)); // FASTSTOCHK

FLSK = MA( FSK, slw ); // FULLSTOCHK

FLSD = MA( FLSK, slwd ); // FULLSTOCHD

MaxGraph = 6;
Graph0 = FSK;
Graph0Color = ParamColor("Fast K",colorGreen);
Graph1 = FLSK;
Graph1Color = ParamColor("Full K",colorRed);
Graph2 = FLSD;
Graph2Color =  ParamColor("Full D",colorAqua);
Graph0Style = ParamStyle("FastStoch K",styleThick,maskAll);
Graph1Style = ParamStyle("FullStoch K",styleThick,maskAll);
Graph2Style = ParamStyle("FullStoch D",styleThick,maskAll);
Graph3 = FLSD;
Graph3BarColor =
IIf (Graph3 > ob, colorRed,
IIf (Graph3 < os, colorBrightGreen, colorGrey40));
Graph4 = ob;
Graph4Color = 4;
Graph5 = os;
Graph5Color = colorBrightGreen;
Graph3Style =ParamStyle("BAR 1",styleHistogram | styleThick,maskHistogram );
Graph4Style = Graph5Style =1;// ParamStyle("style");

Title = Name()+" - "+FullName()+
EncodeColor(Graph0Color)+"   FastStochK="+
StrFormat("%1.4g ",fsk)+EncodeColor(Graph1Color)+
"  FullStochK="+StrFormat("%1.4g ",flsk)+
EncodeColor(Graph2Color)+"  FullStochD="+
StrFormat("%1.4g ",flsd);

whengoup = FLSD < os AND Cross(FSK,os) AND FLSK >= Ref(FLSK,-1) AND FLSD >= Ref(FLSD,-1) OR  Cross(FLSD,os) AND //...next line
FSK >= Ref(FSK,-1) AND FLSK >= Ref(FLSK,-1) ;

whengodown = IIf(BarsSince(Cross(os,FSK))==1 AND FLSK < os ,1,0) OR Cross(os,FSK) AND FLSK < Ref(FLSK,-1) OR FLSK < ob //...next line
AND FLSK > os AND FLSK <= Ref(FLSK,-1) OR FSK > ob AND FLSK > ob AND FLSD > ob AND FSK < Ref(FSK,-1) AND FLSK < Ref(FLSK,-1) //...next line
AND FLSD <= Ref(FLSD,-1) OR FSK > ob AND FLSK > ob AND FLSD > ob AND Cross(ob,FLSK);

Buy = whengoup;
Sell = whengodown;

Buy = ExRem(Buy,Sell);
Sell = ExRem(Sell,Buy);
_SECTION_END();
0 comments
Leave Comment
Please login here to leave a comment.
Back