Stock Portfolio Organizer
The ultimate porfolio management solution.
Shares, Margin, CFD's, Futures and Forex
EOD and Realtime
Dividends and Trust Distributions
And Much More ....
WiseTrader Toolbox
#1 Selling Amibroker Plugin featuring:
Advanced Adaptive Indicators
Advanced Pattern Exploration
Neural Networks
And Much More ....
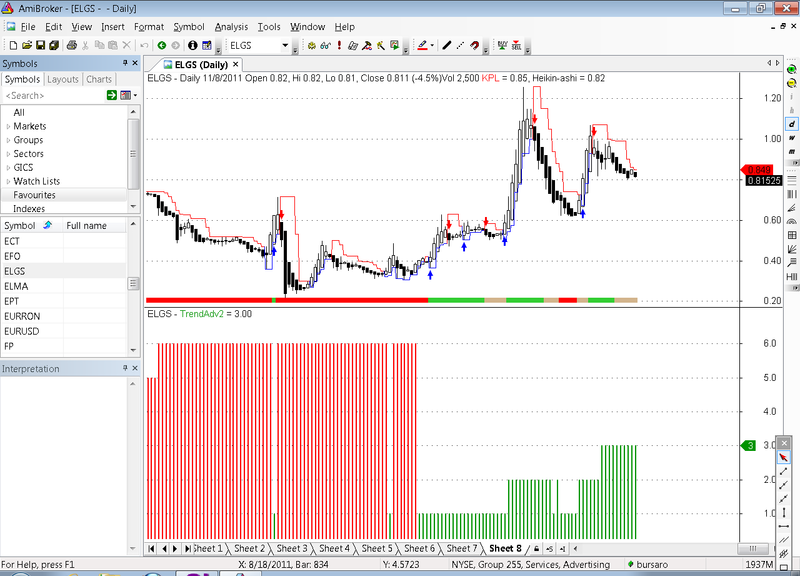
KPL5~2&HA for Amibroker (AFL)
Rating:
3 / 5 (Votes 3)
Tags:
trading system, amibroker
KPL with some improvements: different ResSup-adjustable, Heikin-ashi etc.
Screenshots
Similar Indicators / Formulas
All in One
Submitted
by Nahid over 13 years ago
Kase Peak Osc. V2 batu
Submitted
by batu1453 almost 10 years ago
Kase CD V2batu
Submitted
by batu1453 almost 10 years ago
Ichimoku
Submitted
by prashantrdx almost 10 years ago
Arvind' System
Submitted
by akdabc almost 14 years ago
Miftha remix for dse
Submitted
by coolpace over 13 years ago
Indicator / Formula
Copy & Paste Friendly
//PRICE
_SECTION_BEGIN("Price");
//SetChartOptions(0,chartShowArrows|chartShowDates);
_N(Title = StrFormat("{{NAME}} - {{INTERVAL}} {{DATE}} Open %g, Hi %g, Lo %g, Close %g (%.1f%%)Vol " +WriteVal( V, 1.0 ) +
           " {{VALUES}}", O, H, L, C, SelectedValue( ROC( C, 1 )) ));
//Plot( C, "", ParamColor("Color", colorBlack ), styleNoTitle | ParamStyle("Style") | GetPriceStyle() );
_SECTION_END();
//xxxxxxxxxxxxxxxxxxxxxxxxxxxxxxxxxxxxxxxxxxxxxxxxxxxxxxxxxxxxxxxxxxxxxxxxxxxxxxxxxxxxxxxxxxxxxxxxxxxxxxxxxxxxxxxxxxxx
//TRENDING RIBBON
// Paste the code below to your price chart somewhere and green ribbon means both
// both MACD and ADX trending up so if the red ribbon shows up the MACD and the ADX
// are both trending down.
_SECTION_BEGIN("trending ribbon");
uptrend=PDI()>MDI() AND MACD()>Signal();
downtrend=MDI()>PDI() AND Signal()>MACD();
Plot( 2, /* defines the height of the ribbon in percent of pane width */"",
    IIf( uptrend AND EMA(C,50)>=Ref(EMA(C,50),-1), colorLime, IIf( downtrend OR EMA(C,50)<Ref(EMA(C,50),-1),
     colorRed, colorTan)) , /* choose color */styleOwnScale|styleArea|styleNoLabel, -0.5, 100 );
_SECTION_END();
//xxxxxxxxxxxxxxxxxxxxxxxxxxxxxxxxxxxxxxxxxxxxxxxxxxxxxxxxxxxxxxxxxxxxxxxxxxxxxxxxxxxxxxxxxxxxxxxxxxxxxxxxx

//TREND ADVISER

pointer[0] = 0;

/* Phase filter */

Cond1 = Close > MA(Close, 50)AND NOT(Close > MA(Close, 200))AND NOT(MA(Close, 50) > MA(Close, 200));
Cond2 = Close > MA(Close, 50)AND Close > MA(Close, 200)AND NOT(MA(Close, 50) > MA(Close, 200));
Cond3 = Close > MA(Close, 50)AND Close > MA(Close, 200)AND MA(Close, 50) > MA(Close, 200);
Cond4 = NOT(Close > MA(Close, 50))AND Close > MA(Close, 200)AND MA(Close, 50) > MA(Close, 200);
Cond5 = NOT(Close > MA(Close, 50))AND NOT(Close > MA(Close, 200))AND MA(Close, 50) > MA(Close, 200);
Cond6 = NOT(Close > MA(Close, 50))AND NOT(Close > MA(Close, 200))AND NOT(MA(Close, 50) > MA(Close, 200));


for (i = 1; i < BarCount; i++)
{

  if (Cond1[i])
    pointer[i] = 1;
  if (Cond2[i])
    pointer[i] = 2;
  if (Cond3[i])
    pointer[i] = 3;
  if (Cond4[i])
    pointer[i] = 4;
  if (Cond5[i])
    pointer[i] = 5;
  if (Cond6[i])
    pointer[i] = 6;

}

/* Plot Graphic */
//GraphXSpace= 15 ;
dynamic_color = IIf(pointer < 4, colorGreen, colorRed);
//Plot(pointer, "TrendAdv2", dynamic_color, styleHistogram | styleThick, Null, Null, 0);
//SetChartBkGradientFill(ParamColor("BgTop", colorWhite), ParamColor("BgBottom", colorLightYellow));
Cond= pointer < 4 ;
//xxxxxxxxxxxxxxxxxxxxxxxxxxxxxxxxxxxxxxxxxxxxxxxxxxxxxxxxxxxxxxxxxxxxxxxxxxxxxxxxxxxxxxxxxxxxxxxxxxxx

//KPL

/* my entry is very simple(daily data for trading)

kpl system for entry only & exit as follow:

1 st exit at x % from entry price only 1/3 quantity.(ie 1st profit target)
2 nd exit when exit Signal comes from kpl sys remaining 1/3 quantity.
3. scale-in to initial quantity if new kpl Buy Signal comes.
re-do above scaling-out & scaling-in till filal exit.
4. final exit all quantity when Close below 21 Day EMA.

kpl system code bellow :
*/
//AFL by Kamalesh Langote. Email:kpl@...
noR =Param( "SwingR", 5, 1, 55 ) ;
noS =Param( "SwingS", 2, 1, 55 ) ;
res=HHV(H,noR);
sup=LLV(L,noS);
avd=IIf(C>Ref(res,-1),1,IIf(C<Ref(sup,-1),-1,0));
avn=ValueWhen(avd!=0,avd,1);
tsl=IIf(avn==1,sup,res);
//tsl_col=ParamColor( "Color", colorCycle );
tsl_col= IIf(avn==1,colorBlue,colorRed );
Plot(tsl, "KPL", tsl_col, styleStaircase | styleThick);
//shape=Buy*shapeUpArrow + Sell*shapeDownArrow;
//PlotShapes(shape,IIf(Buy,colorBlue,colorRed),0,IIf(Buy,Low,High));
SetPositionSize(300,spsShares);
ApplyStop(0,1,10,1);
//xxxxxxxxxxxxxxxxxxxxxxxxxxxxxxxxxxxxxxxxxxxxxxxxxxxxxxxxxxxxxxxxxxxxxxxxxxxxxxxxxxxxxxxxxxxxx

//HEIKIN-ASHI
//SetChartOptions(0,chartShowArrows | chartShowDates);
HaClose = (O + H + L + C)/4;
HaOpen = AMA( Ref( HaClose, -1 ), 0.5 );
HaHigh = Max( H, Max( HaClose, HaOpen ) );
HaLow = Min( L, Min( HaClose, HaOpen ) );
xDiff = (HaHigh - Halow) * 10000;
//barcolor = IIf(HaClose >= HaOpen,colorGreen,colorRed);
barcolor= IIf(HaClose>=HaOpen,colorGreen,colorRed) ;
//SetBarFillColor(IIf(HaClose>=HaOpen,colorLime,colorRed));
PlotOHLC( HaOpen, HaHigh, HaLow, HaClose, "Heikin-ashi", colorBlack, styleCandle );
//xxxxxxxxxxxxxxxxxxxxxxxxxxxxxxxxxxxxxxxxxxxxxxxxxxxxxxxxxxxxxxxxxxxxxxxxxxxxxxxxxxxxxxxxxxxxxxx

//FORMULE
P = ParamField("Price field",-1);
cuptop1= C>BBandTop(p,20,1) ;
bot1= BBandBot(p,20,1) ;
top2= BBandTop(p,20,2) ;
bot2= BBandBot(p,20,2) ;
stochup= StochK()>StochD() ;
MACDup= MACD()>Signal() ;
Hist= MACD()-Signal() ;
Histup= Hist>Ref(Hist,-1) ;
MFIupema5= MFI()>EMA(MFI(),5) ;
Cupo= C>=O ;
top1up= BBandTop(p,20,1)>=Ref(BBandTop(p,20,1),-1) ;
top2up= BBandTop(p,20,2)>=Ref(BBandTop(p,20,2),-1) ;
band= BBandTop(p,20,2)-BBandBot(p,20,2) ;
Volatbuy= band>Ref(band,-1) ;
cupbot1= C>BBandBot(p,20,1) ;
bot1up= BBandBot(p,20,1)>Ref(BBandBot(p,20,1),-1) ;
MA20up= MA(C,20)>=Ref(MA(C,20),-1) ;
EMA50up= EMA(C,50)>=Ref(EMA(C,50),-1) ;
Vup10= V>10000 AND C>O ;
Vupma= MA(V,5)>MA(V,21) ;
CCIup0= CCI()>0 ;
CCI200= CCI()<200 ;
Cupma20= C>MA(C,20) ;
ADXup= ADX()>=Ref(ADX(),-1) ;
ADX45= ADX()<45 ;
PDIupmdi= PDI()>MDI() ;
Cond= pointer<4 ;
heikinup= HaClose>=HaOpen ;
//xxxxxxxxxxxxxxxxxxxxxxxxxxxxxxxxxxxxxxxxxxxxxxxxxxxxxxxxxxxxxxxxxxxxxxxxxxxxxxxxxxxxxxxxxxxxxxxxxxxxxxx

myBuy= C>tsl AND Cond AND Heikinup AND Cupo AND EMA50up ;
mySell= C<tsl ;

Buy= ExRem(mybuy,mysell) ;
Sell= ExRem(mysell,mybuy) ;

shape=Buy*shapeUpArrow + Sell*shapeDownArrow;
PlotShapes(shape,IIf(Buy,colorBlue,colorRed),0,IIf(Buy,HaLow,HaHigh));
7 comments
Leave Comment
Please login here to leave a comment.
Back
very nice short indicator
thanks alot
frumos , imi place , nu stiam de unde cunosc simbolul ELGS , poti sa imi dai si mie o adresa de mail , te rog ?
gtudor,care e adresa ta?
uite adresa mea
costan.nicu@yahoo.com
hI
we dont have supply demand formula in amibroker.
http://ultimaforex.com/free-forex-indicator/supdem-supply-and-demand-indicator/
can some expert try to code it in afl please
the other power equation is in mt4
II_supdemV2 -ALSO mt4code
hope somebody can code it in afl
regards
ford
To ford7k.
Look in Wisestocktrader for:
1)Demand Indicator;
2)Bull Bear Volume.
I think BullBearVolume is better.
Wonderful, This is very good indocator.