Stock Portfolio Organizer
The ultimate porfolio management solution.
Shares, Margin, CFD's, Futures and Forex
EOD and Realtime
Dividends and Trust Distributions
And Much More ....
WiseTrader Toolbox
#1 Selling Amibroker Plugin featuring:
Advanced Adaptive Indicators
Advanced Pattern Exploration
Neural Networks
And Much More ....
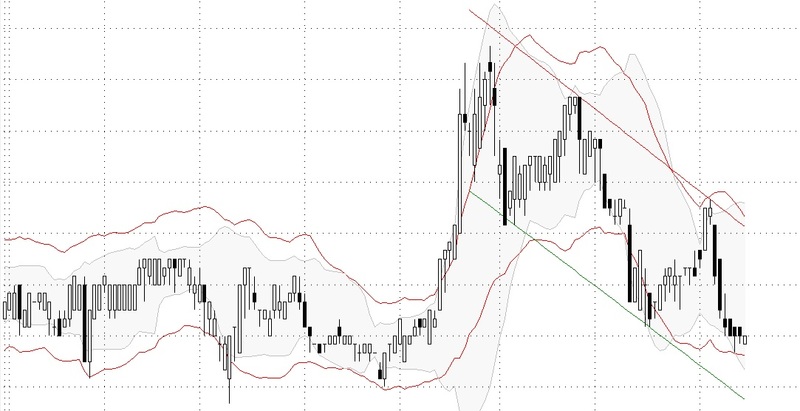
Bollinger and Keltner Bands w/ Pattern Revealer for Amibroker (AFL)
Rating:
2 / 5 (Votes 4)
Tags:
amibroker, pattern, bands
A simple afl for BB Bands and Keltner Bands which indicates trendlines.
Screenshots
Similar Indicators / Formulas
NMN Bollinger Entry
Submitted
by dayTrader about 13 years ago
Top finder
Submitted
by wildeazoscar over 12 years ago
Head & Shoulders Pattern
Submitted
by anandnst almost 14 years ago
BB Trading
Submitted
by iknow_u2_2 about 15 years ago
Indicator / Formula
Copy & Paste Friendly
1 2 3 4 5 6 7 8 9 10 11 12 13 14 15 16 17 18 19 20 21 22 23 24 25 26 27 28 29 30 31 32 33 34 35 36 37 38 39 40 41 42 43 44 45 46 47 48 49 50 51 52 53 54 55 56 57 58 59 60 61 62 63 64 65 66 67 68 69 70 71 72 73 74 75 76 77 78 79 80 81 82 83 84 85 86 87 88 89 90 91 92 93 94 95 96 97 98 99 100 101 102 103 104 105 106 107 108 109 110 111 112 113 114 115 116 117 118 119 120 121 122 123 124 125 126 127 128 129 130 131 132 133 134 135 136 137 138 139 140 141 142 143 144 145 146 147 148 149 150 151 152 153 154 155 156 157 158 159 160 161 | _SECTION_BEGIN("Pattern Revealer");//Pattern Recognition graph with shading /*TRENDLINES BREAKOUT*/ x = Cum(1); per = Param("Percent",3,1,5,1); s1=L; s11=H; pS = TroughBars( s1, per, 1 ) == 0; endt= LastValue(ValueWhen( pS, x, 1 )); startt=LastValue(ValueWhen( pS, x, 2 )); endS = LastValue(ValueWhen( pS, s1, 1 ) ); startS = LastValue( ValueWhen( pS, s1, 2 )); dtS =endt-startt; aS = (endS-startS)/dtS; bS = endS; trendlineS = aS * ( x -endt ) + bS; pR = PeakBars( s11, per, 1 ) == 0; endt1= LastValue(ValueWhen( pR, x, 1 )); startt1=LastValue(ValueWhen( pR, x, 2 )); endR = LastValue(ValueWhen( pR, s11, 1 ) ); startR = LastValue( ValueWhen( pR, s11, 2 )); DTR=ENDT1-STARTT1; aR = (endR-startR)/dtR; bR = endR; trendlineR = aR * ( x -endt1 ) + bR; BEGIN=Min(STARTT,STARTT1); TRS = IIf(x>BEGIN-10,trendlineS,-1e10); TRR = IIf(x>BEGIN-10,trendlineR,-1e10); Condcolor=(Cross(C,trendlineR) AND X>ENDT1) OR (Cross(trendlineS,C) AND X>ENDT); BarColor=IIf(Condcolor,7,1); Plot(C,"Close",BarColor,styleCandle); Plot(TRS,"Support",colorGreen,styleLine); Plot(TRR,"Resist",colorRed,styleLine); //////////////////////////////////////////// // Pattern Recognition in title bar // /////////////////////////////////////////// Lowline=Ends-starts; Highline=endr-startr; Wedge=IIf(Highline <0 AND Lowline > 0,1,0); DecendingTriangle=IIf(Highline < 0 AND Lowline==0,1,0); AscendingTriangle=IIf(Highline==0 AND Lowline > 0,1,0); DownChannel=IIf(Highline<0 AND Lowline<0,1,0); UpChannel=IIf(Highline>0 AND Lowline>0,1,0); BroadeningWedge=IIf(Highline > 0 AND Lowline < 0,1,0); /////////////////////////////////// // Bullish or Bearish breakout // ////////////////////////////////// BullishBreakout=Cross(C,trendlineR); BearishBreakout=Cross(trendlineS,C); Title=Name()+ WriteIf(wedge==1," Wedge","")+WriteIf(DecendingTriangle==1," Decending Triangle","")+WriteIf(AscendingTriangle==1,"Ascending Triangle","")/*+WriteVal(Lowline)*/+WriteIf(DownChannel==1," Downward Sloping Channel","")+WriteIf(UpChannel==1," Upward Sloping Channel","")+WriteIf(broadeningWedge==1," Broadening Wedge","")+"\n"+EncodeColor(colorGreen)+WriteIf(bullishbreakout,"Bullish Breakout",EncodeColor(colorRed)+WriteIf(bearishbreakout,"Bearish Breakout",""))/*+WriteVal(highline)*/; ///////////////////////////////////// // Automatic Analysis // //////////////////////////////////// Filter=AscendingTriangle OR DecendingTriangle OR Wedge OR DownChannel OR UpChannel OR BroadeningWedge OR Bullishbreakout OR bearishbreakout; AddTextColumn(WriteIf(bullishbreakout,"bullish Breakout",""),"BullBreak"); AddTextColumn(WriteIf(bearishBreakout,"Bearish Breakout",""),"BearBreak"); AddTextColumn(WriteIf(ascendingtriangle,"Ascending Triangle",WriteIf(decendingtriangle,"Decending Triangle",WriteIf(Wedge,"Wedge",WriteIf(DownChannel,"Down Channel",WriteIf(UpChannel,"Up Channel",WriteIf(BroadeningWedge,"Broadening Wedge","")))))),"Pattern"); AddColumn(C,"Close");_SECTION_END();_SECTION_BEGIN("Price");SetChartOptions(0,chartShowArrows|chartShowDates);_N(Title = StrFormat("{{NAME}} - {{INTERVAL}} {{DATE}} Open %g, Hi %g, Lo %g, Close %g (%.1f%%) {{VALUES}}", O, H, L, C, SelectedValue( ROC( C, 1 ) ) ));Plot( C, "Close", ParamColor("Color", colorBlack ), styleNoTitle | ParamStyle("Style") | GetPriceStyle() ); _SECTION_END();_SECTION_BEGIN("Bollinger Bands");P = ParamField("Price field",-1);Periods = Param("Periods", 15, 2, 100, 1 );Width = Param("Width", 2, 0, 10, 0.05 );Color = ParamColor("Color", colorLightGrey );Style = ParamStyle("Style") | styleNoRescale;;Plot( bbt = BBandTop( P, Periods, Width ), "BBTop" + _PARAM_VALUES(), Color, Style ); Plot( bbb = BBandBot( P, Periods, Width ), "BBBot" + _PARAM_VALUES(), Color, Style ); PlotOHLC( bbt, bbt, bbb, bbb, "", ColorBlend( Color, colorWhite, 0.9 ), styleCloud | styleNoRescale, Null, Null, Null, -1 );_SECTION_END();_SECTION_BEGIN("Keltner Bands");P = ParamField("Price field",-1);Periods = Param("Periods", 15, 2, 300, 1 );Width = Param("Width", 2, 0, 10, 0.05 );Color = ParamColor("Color", colorCycle );Style = ParamStyle("Style");CenterLine = MA( P, Periods );KTop = CenterLine + Width * ATR( Periods );KBot = CenterLine - Width * ATR( Periods );Plot( KTop, "KBTop" + _PARAM_VALUES(), Color, Style ); Plot( KBot, "KBBot" + _PARAM_VALUES(), Color, Style ); _SECTION_END(); |
0 comments
Leave Comment
Please login here to leave a comment.
Back