Stock Portfolio Organizer
The ultimate porfolio management solution.
WiseTrader Toolbox
#1 Selling Amibroker Plugin featuring:
Six Signal Indicator for Amibroker (AFL)
From the article “The six signal composite indicator,” by Art Collins
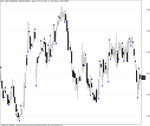
Screenshots
Indicator / Formula
//From the article "The six signal composite indicator," by Art Collins.
//This code can be copied at www.activetradermag.com/code.htm. (OR, select "Strategy code" from the "Tools and resources" menu on the left side of the page.)
ticdiv=1;
periods = 30;
HighHigh = HHV(H, periods);
LowLow = LLV(L, periods);
HiDay = TimeFrameGetPrice("H", inDaily);
LoDay = TimeFrameGetPrice("L", inDaily);
range = Hiday-Loday;//25 / (HighHigh - LowLow) * LowLow;
RangeTitle = EncodeColor(colorWhite) + "Day Range= " + EncodeColor(colorWhite) + StrToNum(NumToStr(round((HiDay - LoDay)/ticdiv), 4.4));

Title=_SECTION_BEGIN("");
_N(Title = "{{NAME}} - {{INTERVAL}} {{DATE}}:: "+_DEFAULT_NAME()+" :: {{OHLCX}} {{VALUES}}"
+"\n"+ rangetitle);
//Component 1: Close vs. 40-Day average
Plot(C,"",1,64);

/*x=40;
Buy= C > MA(C,x); //then Buy next bar at market;
Sell=C < MA(C,x); //then Sell Short next bar at market;
//setexitonclose;

//Component 2: Two-Day/Five-Day average fade
Buy= MA(C,2)<MA(C,5);// then Buy next bar at market;
Sell= MA(C,2)>MA(C,5);// then Sell Short next bar at market;
//setexitonclose;

//Component 3: 50-Day extreme Highest/Lowest Close
m= 50;
Buy= HHVBars(C,m)>LLVBars(C,m); //then Buy next bar at market;
Sell= HHVBars(C,m)<LLVBars(C,m); //then Sell Short next bar at market;
//setexitonclose;

//Component 4: Go-with Close direction following tight ranges, fade following wide ones
n=10;
Buy=range<MA(range,n) AND C> Ref(C,-1) OR range>MA(range,n) AND C<Ref(C,-1);//then Buy next bar at market;
Sell=range<MA(range,n) AND C<Ref(C,-1) OR range>MA(range,n) AND C>Ref(C,-1);//then Sell Short next bar at market;
//setexitonclose;

Component 5: Close vs. 15-Day High-Low averages
if C>(average(H,15)+average(L,15))/2 then Buy next bar at market;
if C<(average(H,15)+average(L,15))/2 then Sell Short next bar at market;
setexitonclose;

Component 6: Fading two of the last three Open-to-Close moves
variables: e(0);
if C>O then e=1;
if C<O then e=-1;
if average(e,3)<0 then Buy next bar at market;
if average(e,3)>0 then Sell Short next bar at market;
setexitonclose;*/

//Six indicators combined
//variables: e(0),aa(0),bb(0),cc(0),dd(0),ee(0),ff(0),gg(0);*/
Plot(C,"",1,128);
e=IIf( C>O ,1,-1);

aa=IIf (MA(C,2)<MA(C,5),1,-1);
//if average(C,2)>average(C,5)then aa=-1;
bb=IIf (C > MA(C,40),1,-1);
//if C<average(C,40) then bb=-1;
cc=IIf (HHVBars(C,50)>LLVBars(C,50),1,-1);
//if highestbar(C,50)<lowestbar(C,50) then cc=-1;
dd=IIf(range<MA(range,10) AND C> Ref(C,-1) OR range>MA(range,10) AND C<Ref(C,-1),1,-1);
//if (range<average(range,10)) AND C<C[1] OR (range>average(range,10)) AND C>C[1] then dd=-1;
ee=IIf( C>(MA(H,15)+MA(L,15))/2,1,-1);
//if C<(average(H,15)+average(L,15))/2 then ee=-1;
ff=IIf (MA(e,3)<0 ,1,-1);
//if average(e,3)>0 then ff=-1;
Buy= e+aa+bb+cc+dd+ee+ff>0 ;//then Buy next bar at market;
Sell= e+aa+bb+cc+dd+ee+ff<0 ;//then Sell Short next bar at market;
//setexitonclose;*/
Buy=ExRem(Buy,Sell);Sell=ExRem(Sell,Buy);
PlotShapes( shapeUpArrow * Buy ,6,0,L);
PlotShapes( shapeDownArrow *Sell ,1,0,H);
0 comments
Leave Comment
Please login here to leave a comment.
Back