Stock Portfolio Organizer
The ultimate porfolio management solution.
Shares, Margin, CFD's, Futures and Forex
EOD and Realtime
Dividends and Trust Distributions
And Much More ....
WiseTrader Toolbox
#1 Selling Amibroker Plugin featuring:
Advanced Adaptive Indicators
Advanced Pattern Exploration
Neural Networks
And Much More ....
Buy Sell & Trailing SL & TGL for Amibroker (AFL)
Rating:
3 / 5 (Votes 7)
Tags:
trading system, amibroker, stop loss
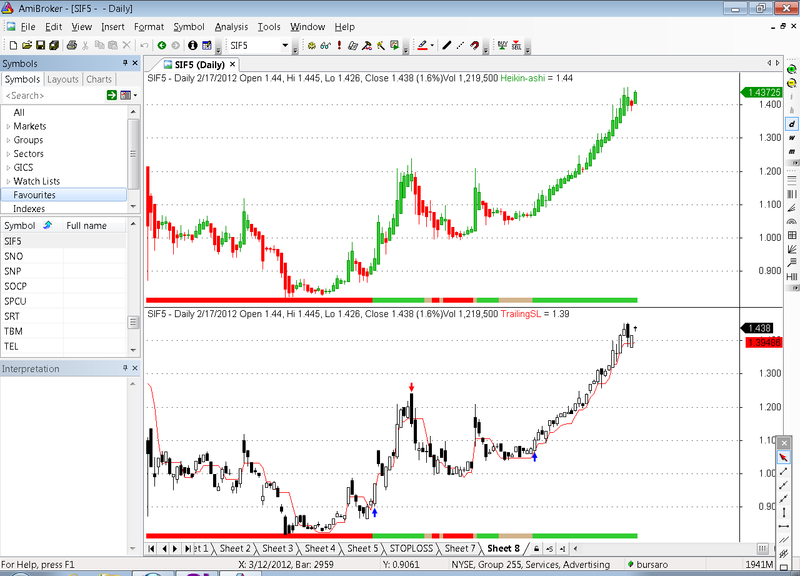
An interesting Trailing Stop Loss.
And a Buy Stop…
merit to Praveen.
Screenshots
Similar Indicators / Formulas
Visual ATR Stop Loss System
Submitted
by siivaramm over 13 years ago
ATR Stop Loss System
Submitted
by esnataraj about 14 years ago
KPL System
Submitted
by na1982 about 14 years ago
Chandelier Exit v2 by Geoff Mulhall
Submitted
by akxsat about 14 years ago
Ensign Volatility Stop
Submitted
by kaiji over 14 years ago
trailing sl
Submitted
by rsuresh13 about 13 years ago
Indicator / Formula
Copy & Paste Friendly
//PRICE
_SECTION_BEGIN("Price");
//SetChartOptions(0,chartShowArrows|chartShowDates);
_N(Title = StrFormat("{{NAME}} - {{INTERVAL}} {{DATE}} Open %g, Hi %g, Lo %g, Close %g (%.1f%%)Vol " +WriteVal( V, 1.0 ) +
           " {{VALUES}}", O, H, L, C, SelectedValue( ROC( C, 1 )) ));
Plot( C, "", ParamColor("Color", colorBlack ), styleNoTitle | ParamStyle("Style") | GetPriceStyle() );
_SECTION_END();
//xxxxxxxxxxxxxxxxxxxxxxxxxxxxxxxxxxxxxxxxxxxxxxxxxxxxxxxxxxxxxxxxxxxxxxxxxxxxxxxxxxxxxxxxxxxxxxxxxxxxxxxxxxxxxxxxxxxx

//TRENDING RIBBON
// Paste the code below to your price chart somewhere and green ribbon means both
// both MACD and ADX trending up so if the red ribbon shows up the MACD and the ADX
// are both trending down.
_SECTION_BEGIN("trending ribbon");
uptrend=PDI()>MDI() AND MACD()>Signal();
downtrend=MDI()>PDI() AND Signal()>MACD();
Plot( 2, /* defines the height of the ribbon in percent of pane width */"",
    IIf( uptrend AND EMA(C,50)>=Ref(EMA(C,50),-1), colorLime, IIf( downtrend OR EMA(C,50)<Ref(EMA(C,50),-1),
     colorRed, colorTan)) , /* choose color */styleOwnScale|styleArea|styleNoLabel, -0.5, 100 );
_SECTION_END();
//xxxxxxxxxxxxxxxxxxxxxxxxxxxxxxxxxxxxxxxxxxxxxxxxxxxxxxxxxxxxxxxxxxxxxxxxxxxxxxxxxxxxxxxxxxxxxxxxxxxxxxxxx

//HEIKIN-ASHI
//SetChartOptions(0,chartShowArrows | chartShowDates);
HaClose = (O + H + L + C)/4;
HaOpen = AMA( Ref( HaClose, -1 ), 0.5 );
HaHigh = Max( H, Max( HaClose, HaOpen ) );
HaLow = Min( L, Min( HaClose, HaOpen ) );
xDiff = (HaHigh - Halow) * 10000;
//barcolor = IIf(HaClose >= HaOpen,colorGreen,colorRed);
barcolor= IIf(HaClose>=HaOpen,colorGreen,colorRed) ;
//SetBarFillColor(IIf(HaClose>=HaOpen,colorBrightGreen,colorOrange));
//PlotOHLC( HaOpen, HaHigh, HaLow, HaClose, "HA", barcolor, styleCandle );
HaDelta= (HaClose-HaOpen) ;
MAhadelta= MA(Hadelta,3) ;
Hadeltaupmahadelta = Hadelta>MAhadelta ;
cphadelta = hadelta>0 AND hadelta>MAhadelta ;
vdhadelta = hadelta<MAhadelta  ;
//xxxxxxxxxxxxxxxxxxxxxxxxxxxxxxxxxxxxxxxxxxxxxxxxxxxxxxxxxxxxxxxxxxxxxxxxxxxxxxxxxxxxxxxxxxxxxxx

//TRENDADVISOR

pointer[0] = 0;

/* Phase filter */

Cond1 = Close > MA(Close, 50)AND NOT(Close > MA(Close, 200))AND NOT(MA(Close, 50) > MA(Close, 200));
Cond2 = Close > MA(Close, 50)AND Close > MA(Close, 200)AND NOT(MA(Close, 50) > MA(Close, 200));
Cond3 = Close > MA(Close, 50)AND Close > MA(Close, 200)AND MA(Close, 50) > MA(Close, 200);
Cond4 = NOT(Close > MA(Close, 50))AND Close > MA(Close, 200)AND MA(Close, 50) > MA(Close, 200);
Cond5 = NOT(Close > MA(Close, 50))AND NOT(Close > MA(Close, 200))AND MA(Close, 50) > MA(Close, 200);
Cond6 = NOT(Close > MA(Close, 50))AND NOT(Close > MA(Close, 200))AND NOT(MA(Close, 50) > MA(Close, 200));

for (i = 1; i < BarCount; i++)
{

  if (Cond1[i])
    pointer[i] = 1;
  if (Cond2[i])
    pointer[i] = 2;
  if (Cond3[i])
    pointer[i] = 3;
  if (Cond4[i])
    pointer[i] = 4;
  if (Cond5[i])
    pointer[i] = 5;
  if (Cond6[i])
    pointer[i] = 6;

}

/* Plot Graphic */
//GraphXSpace= 15 ;
dynamic_color = IIf(pointer < 4, colorGreen, colorRed);
//Plot(pointer, "TrendAdv2", dynamic_color, styleHistogram | styleThick, Null, Null, 0);
//SetChartBkGradientFill(ParamColor("BgTop", colorWhite), ParamColor("BgBottom", colorLightYellow));
//xxxxxxxxxxxxxxxxxxxxxxxxxxxxxxxxxxxxxxxxxxxxxxxxxxxxxxxxxxxxxxxxxxxxxxxxxxxxxxxxxxxxxxxxxxxxxxxxxxxxxxxxxxx


//STOP LOSS
//The formula draws a stoploss loss line which will be 2% below the Highest Close within a lookback period of 5 bars.
//You can change these parameters.

lookbackPeriod = Param("Lookback period", 5, 1, 30);
stoplossPercentage = Param("Stoploss Percentage", 3, 2, 10);
TrailingSL= HHV(C,lookbackPeriod) - HHV(C,lookbackPeriod) * (stoplossPercentage / 100) ;
//Plot(HHV(C,lookbackPeriod) - HHV(C,lookbackPeriod) * (stoplossPercentage / 100), "TrailingSL", ParamColor( "Color", colorCycle ));
Plot(TrailingSL, "TrailingSL", ParamColor( "Color", colorCycle ));
//Author: Praveen.
//xxxxxxxxxxxxxxxxxxxxxxxxxxxxxxxxxxxxxxxxxxxxxxxxxxxxxxxxxxxxxxxxxxxxxxxxxxxxxxxxxxxxxxxxxxxxxxxxxxxxxxxxxxxxxxxxxxxxxxxxxxxxxxxxxx

//FORMULE
stochup= StochK()>StochD() ;
stoch50= StochK()<50 ;
MACDup= MACD()>Signal() ;
Hist= MACD()-Signal() ;
Histup= Hist>Ref(Hist,-1) ;
MFIupema5= MFI()>EMA(MFI(),5) ;
MFI30= MFI()>30 ;
Cupo= C>O ;
MA10up= MA(C,10)>Ref(MA(C,10),-1) ;
MA20up= MA(C,20)>Ref(MA(C,20),-1) ;
EMA50up= EMA(C,50)>Ref(EMA(C,50),-1) ;
Cupma20= C>MA(C,20) ;
PDIupmdi= PDI()>MDI() ;
Cond= pointer<4 ;
haup= HaClose>=HaOpen ;
HaCloseuptop1= HaClose>BBandTop( C, 20,1 ) ;
top2up= BBandTop(C,20,2)>Ref(BBandTop(C,20,2),-1) ;
Cuptop1= C>BBandTop(C,20,1) ;
nogap= O<=Ref(H,-1) ;
Cupma10= C>MA(C,10) ;
Vdrule= Ref(L,-2)>C AND Ref(L,-1)>C ;
CupTrailingSL= C>TrailingSL ;
//xxxxxxxxxxxxxxxxxxxxxxxxxxxxxxxxxxxxxxxxxxxxxxxxxxxxxxxxxxxxxxxxxxxxxxxxxxxxxxxxxxxxxxxxxxxxxxxxxxxxxxxxxxxxxxxxx

//PARAMTOGGLE
// This combines indicators into one timing Signal
//function ParamOptimize( description, default, minv, maxv, step )
//    { return Optimize(description, Param(description,default, minv, maxv, step ), minv, maxv, step ); }
tgl = ParamToggle("Result", "AND logic|Compare");
// switch test calculation and compare the results
if(tgl)
{
myBuy = CupTrailingSL AND macdup AND histup AND cond AND cupo AND ema50up AND ma20up ;
myShort = !CupTrailingSL AND !stochup AND Vdhadelta AND !Cupo ;
}
else
{
myBuy   = IIf( C>TrailingSL AND MACD()>Signal() AND Hist>Ref(Hist,-1) AND pointer<4 AND C>O AND
          EMA(C,50)>Ref(EMA(C,50),-1) AND MA(C,20)>Ref(MA(C,20),-1)    ,1,0);
myShort = IIf( C<TrailingSL AND StochK()<StochD() AND hadelta<MAhadelta AND C<O      ,1,0);
}

Buy = ExRem(myBuy, myShort);
Sell = ExRem(myShort, myBuy);

PlotShapes(IIf(Buy,shapeUpArrow,shapeNone),colorBlue,0,haLow,Offset=-10);
PlotShapes(IIf(Sell,shapeDownArrow,shapeNone),colorRed,0,Hahigh,Offset=-10);
1 comments
Leave Comment
Please login here to leave a comment.
Back
good for EOD