Stock Portfolio Organizer
The ultimate porfolio management solution.
Shares, Margin, CFD's, Futures and Forex
EOD and Realtime
Dividends and Trust Distributions
And Much More ....
WiseTrader Toolbox
#1 Selling Amibroker Plugin featuring:
Advanced Adaptive Indicators
Advanced Pattern Exploration
Neural Networks
And Much More ....
Smooth RSI for Amibroker (AFL)
Rating:
3 / 5 (Votes 9)
Tags:
oscillator, amibroker
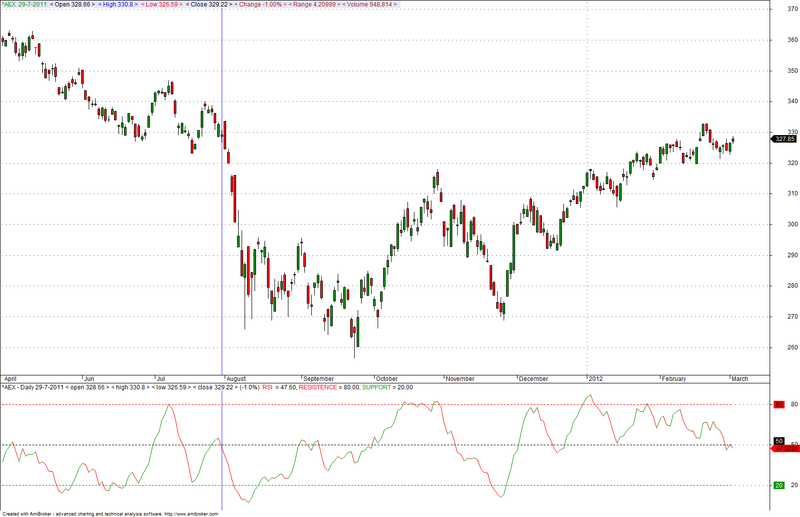
this one is particular useful to me. Especially with drawing lines, I can predict a bounce pretty accurately on the dutch aex.
notice that myarray skips 2 previous bars, but uses the third. That worked the best on the aex.
although optimize is present in the code, you can’t use it yet, since it has no criteria to buy/sell
anyway….a good indicator, and worth to have a look at!
Screenshots
Similar Indicators / Formulas
Febo RSI ..real indicator
Submitted
by abhinavsingh over 12 years ago
Trading Volume Statistic
Submitted
by tuanstock1 almost 10 years ago
Ergodic Oscillator
Submitted
by dljtrader over 13 years ago
3 Days Track
Submitted
by janet0211 almost 14 years ago
Chande Momentum Oscillator
Submitted
by klimpek over 13 years ago
Inverse Fisher Transform Stochastic Oscillator
Submitted
by northstar over 12 years ago
Indicator / Formula
Copy & Paste Friendly
_SECTION_BEGIN("_smooth rsi");
SetChartOptions(0,0,chartGrid20 |chartGrid50 |chartGrid80);
_N(Title = StrFormat("{{NAME}} - {{INTERVAL}} {{DATE}} < open %g > < high %g > < low %g > < close %g > (%.1f%%) {{VALUES}}", O, H, L, C, SelectedValue( ROC( C, 1 ) ) ));
SetChartBkColor(ParamColor("Outer panel color ",colorWhite)); // color of outer border
SetChartBkGradientFill( ParamColor("Inner panel color upper half",colorWhite),
ParamColor("Inner panel color lower half",colorWhite)//color of inner panel
,ParamColor("behind Text Color", colorWhite));
GraphXSpace=5;

Hc=(O+H+L+C)/4;

Ho = AMA( Ref( Hc, -1 ), 0.5 );

pds = Optimize("pds ",Param("pds ",5,1,15,1),5,5,1);
myArray = (RSI( pds )+ RSIa( Ho,pds ) + Ref(RSIa(Ho,pds),-3))/3 ;
Plot( myArray , " RSI ", IIf( myArray >Ref(myArray ,-1), colorGreen, colorRed ));
Plot(80,"RESISTENCE",colorRed, styleLine|styleDashed | styleThick);
Plot(50,"",colorBlack, styleLine|styleDashed | styleThick);
Plot(20,"SUPPORT",colorGreen, styleLine|styleDashed | styleThick);
_SECTION_END();
4 comments
Leave Comment
Please login here to leave a comment.
Back
Great, thanks for sharing
GOOD ONE SIR AND THANKS FOR SHARING
PRASAD
INTERPRETATION OF THE SAME :: BUY A STOCK WHICH CROSSES ABOVE 50 AND HOLD IT TILL IT IS ABOVE 50 (RSI) AND SELL IT ABOVE 80. WATCH THE ACCURACY
GOOD ONE SIR AND THANKS FOR SHARING
PRASAD