Stock Portfolio Organizer
The ultimate porfolio management solution.
Shares, Margin, CFD's, Futures and Forex
EOD and Realtime
Dividends and Trust Distributions
And Much More ....
WiseTrader Toolbox
#1 Selling Amibroker Plugin featuring:
Advanced Adaptive Indicators
Advanced Pattern Exploration
Neural Networks
And Much More ....
Time Channel for Amibroker (AFL)
Rating:
3 / 5 (Votes 6)
Tags:
amibroker, timeframe
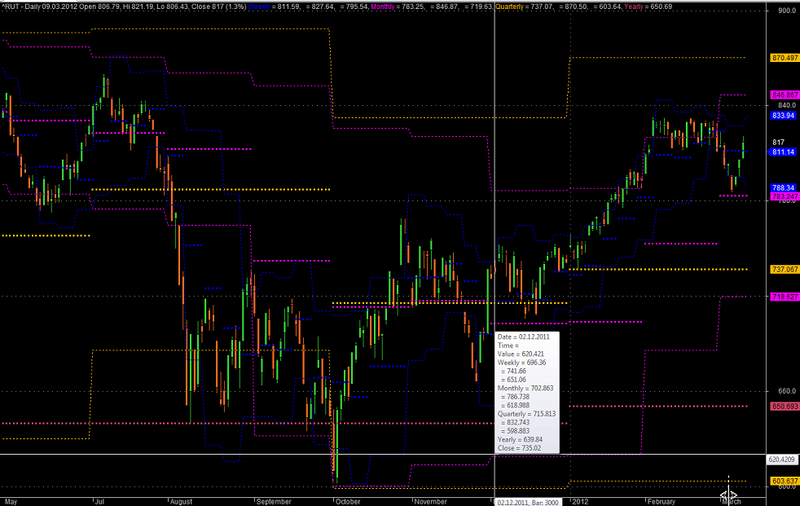
Time channels. Pivot levels of different time frames – Weekly, Monthly, Quarterly, Yearly.
For a better understanding of the strategy read Frank Dilernia.
Screenshots
Similar Indicators / Formulas
Different Time Frames In one Chart
Submitted
by ABUSLIMAN06 over 12 years ago
KaKa MultiTimeFrame
Submitted
by shogun over 12 years ago
multi time frame with pivot
Submitted
by njethva almost 11 years ago
RSI of WRO and WSO
Submitted
by AKJWYXZ about 12 years ago
Marlyn't NewMomo
Submitted
by genkumag over 12 years ago
Weekly EMA on Daily Chart
Submitted
by rohann almost 10 years ago
Indicator / Formula
Copy & Paste Friendly
_SECTION_BEGIN("Weekly");
TimeFrameSet( inWeekly);

Piv = ( HHV(H, 3) + LLV(L, 3) + C )/3 ;
HL = ( HHV(H, 3) - LLV(L, 3) )/2 ;
up = Piv + HL ;
dn = Piv - HL ;

TimeFrameRestore();

Plot( TimeFrameExpand( Piv, inWeekly), "Weekly", colorBlue, styleDots|styleNoLine, Null, Null, 1 );
Plot( TimeFrameExpand( up, inWeekly),  " ", colorBlue, styleDashed, Null, Null, 1 );
Plot( TimeFrameExpand( dn, inWeekly), " ", colorBlue, styleDashed, Null, Null, 1 );

_SECTION_END();


_SECTION_BEGIN("Monthly");
 TimeFrameSet( inMonthly);

Piv = ( HHV(H, 3) + LLV(L, 3) + C )/3 ;
HL = ( HHV(H, 3) - LLV(L, 3) )/2 ;
up = Piv + HL ;
dn = Piv - HL ;

TimeFrameRestore();

Plot( TimeFrameExpand( piv, inMonthly), "Monthly", colorCustom12, styleDots|styleNoLine, Null, Null, 1 );
Plot( TimeFrameExpand( up, inMonthly),  " ", colorCustom12, styleDashed, Null, Null, 1 );
Plot( TimeFrameExpand( dn, inMonthly), " ", colorCustom12, styleDashed, Null, Null, 1 );

_SECTION_END();

_SECTION_BEGIN("Quarterly");
 TimeFrameSet( inQuarterly);

Piv = ( HHV(H, 3) + LLV(L, 3) + C )/3 ;
HL = ( HHV(H, 3) - LLV(L, 3) )/2 ;
up = Piv + HL ;
dn = Piv - HL ;

TimeFrameRestore();

Plot( TimeFrameExpand( piv, inQuarterly), "Quarterly", colorCustom10, styleDots|styleNoLine, Null, Null, 1 );
Plot( TimeFrameExpand( up, inQuarterly),  " ", colorCustom10, styleDashed, Null, Null, 1 );
Plot( TimeFrameExpand( dn, inQuarterly), " ", colorCustom10, styleDashed, Null, Null, 1 );

_SECTION_END();

_SECTION_BEGIN("Yearly");
 TimeFrameSet( inYearly);

Piv = ( HHV(H, 3) + LLV(L, 3) + C )/3 ;
HL = ( HHV(H, 3) - LLV(L, 3) )/2 ;
up = Piv + HL ;
dn = Piv - HL ;


TimeFrameRestore();

Plot( TimeFrameExpand( piv, inYearly), "Yearly", colorCustom16, styleDots|styleNoLine, Null, Null, 1 );
//Plot( TimeFrameExpand( up, inYearly),  " ", colorCustom16, styleDashed, Null, Null, 1 );
//Plot( TimeFrameExpand( dn, inYearly), " ", colorCustom16, styleDashed, Null, Null, 1 );

_SECTION_END();
1 comments
Leave Comment
Please login here to leave a comment.
Back
This system excellent!!!. I have changed the arrangement of the line styles and colors as I like them and recommend systems : Year,Quarter and Month for the Daily and Weekly analysis, Y,Q,M and W for the Daily Time-frame, Month,Week,Day and Hour system for Hourly, 30Min or 15Min time-frames is good(for day-trading).Many things can be done with this code. Thanks for posting-this is the best ever and no other indicators are needed at all!
For the explanation of this system – this is the site :
http://www.datafeeds.com.au/AMT_articles.html