Stock Portfolio Organizer
The ultimate porfolio management solution.
Shares, Margin, CFD's, Futures and Forex
EOD and Realtime
Dividends and Trust Distributions
And Much More ....
WiseTrader Toolbox
#1 Selling Amibroker Plugin featuring:
Advanced Adaptive Indicators
Advanced Pattern Exploration
Neural Networks
And Much More ....
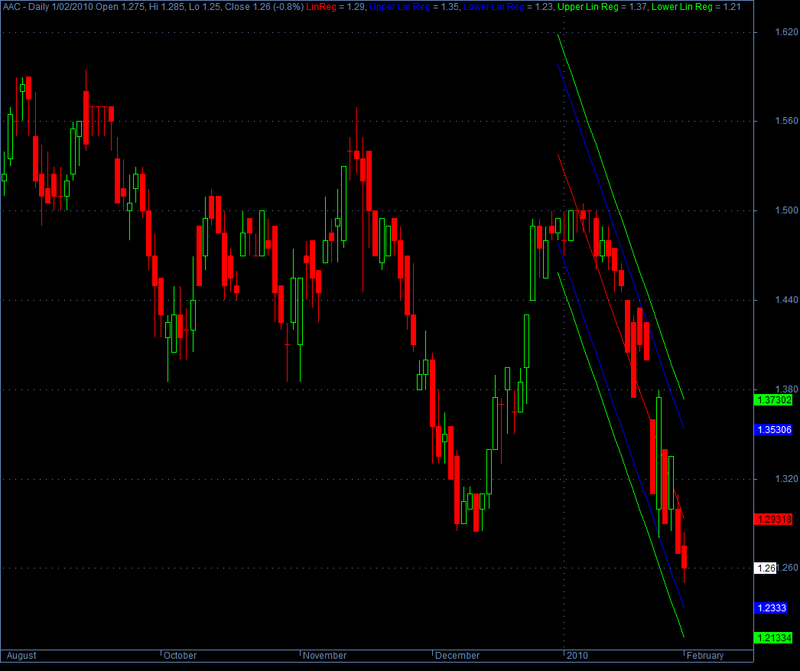
Intraday Tick Price With Regression Channel for Amibroker (AFL)
Rating:
5 / 5 (Votes 1)
Tags:
amibroker, channel
Here is the combination of two formulas which gives intraday Tick Price with regression channel. I used background color black.
Screenshots
Indicator / Formula
Copy & Paste Friendly
_SECTION_BEGIN("Price With Regression Channel");

//LISTING 1;
SetChartOptions(0,chartShowArrows|chartShowDates);
_N(Title = StrFormat("{{NAME}} - {{INTERVAL}} {{DATE}} Open %g, Hi %g, Lo %g, Close %g (%.1f%%) {{VALUES}}", O, H, L, C, SelectedValue( ROC( C, 1 ) ) ));
Plot( C, "Close", ParamColor("Color", colorWhite ), styleNoTitle | ParamStyle("Style") | GetPriceStyle() );


//LISTING 2;

//  Linear Regression Line with 2 Standard Deviation Channels Plotted Above and Below

P = ParamField("Price field",-1);
Daysback = Param("Period for Liner Regression Line",21,1,240,1);
shift = Param("Look back period",0,0,240,1);


//  =============================== Math Formula =============================================================

x = Cum(1);
lastx = LastValue( x ) - shift;
aa = LastValue( Ref(LinRegIntercept( p, Daysback), -shift) );
bb = LastValue( Ref(LinRegSlope( p, Daysback ), -shift) );
y = Aa + bb * ( x - (Lastx - DaysBack +1 ) );


// ==================Plot the Linear Regression Line ==========================================================


LRColor = ParamColor("LR Color", colorCycle );
LRStyle = ParamStyle("LR Style");

LRLine =  IIf( x > (lastx - Daysback) AND BarIndex() < Lastx, y, Null );
Plot( LRLine , "LinReg", LRCOLOR, LRSTYLE ); //  styleDots );

// ==========================  Plot 1st SD Channel ===============================================================

SDP = Param("Standard Deviation", 1.5, 0, 6, 0.1);
SD = SDP/2;

width = LastValue( Ref(SD*StDev(p, Daysback),-shift) );   // THIS IS WHERE THE WIDTH OF THE CHANELS IS SET
SDU = IIf( x > (lastx - Daysback) AND BarIndex() < Lastx, y+width , Null ) ;
SDL = IIf( x > (lastx - Daysback) AND BarIndex() < Lastx, y-width , Null ) ;

SDColor = ParamColor("SD Color", colorCycle );
SDStyle = ParamStyle("SD Style");

Plot( SDU , "Upper Lin Reg", SDColor,SDStyle );
Plot( SDL , "Lower Lin Reg", SDColor,SDStyle );

//  ==========================  Plot 2d SD Channel ===============================================================

SDP2 = Param("2d Standard Deviation", 2.0, 0, 6, 0.1);
SD2 = SDP2/2;

width2 = LastValue( Ref(SD2*StDev(p, Daysback),-shift) );   // THIS IS WHERE THE WIDTH OF THE CHANELS IS SET
SDU2 = IIf( x > (lastx - Daysback) AND BarIndex() < Lastx, y+width2 , Null ) ;
SDL2 = IIf( x > (lastx - Daysback) AND BarIndex() < Lastx, y-width2 , Null ) ;

SDColor2 = ParamColor("2 SD Color", colorCycle );
SDStyle2 = ParamStyle("2 SD Style");

Plot( SDU2 , "Upper Lin Reg", SDColor2,SDStyle2 );
Plot( SDL2 , "Lower Lin Reg", SDColor2,SDStyle2 );

// ============================ End Indicator Code ==============================================================

_SECTION_END();
1 comments
Leave Comment
Please login here to leave a comment.
Back
What is this “Intraday Tick Price” please.
Thanks