Stock Portfolio Organizer
The ultimate porfolio management solution.
Shares, Margin, CFD's, Futures and Forex
EOD and Realtime
Dividends and Trust Distributions
And Much More ....
WiseTrader Toolbox
#1 Selling Amibroker Plugin featuring:
Advanced Adaptive Indicators
Advanced Pattern Exploration
Neural Networks
And Much More ....
ASC clone for Amibroker (AFL)
Rating:
5 / 5 (Votes 1)
Tags:
amibroker
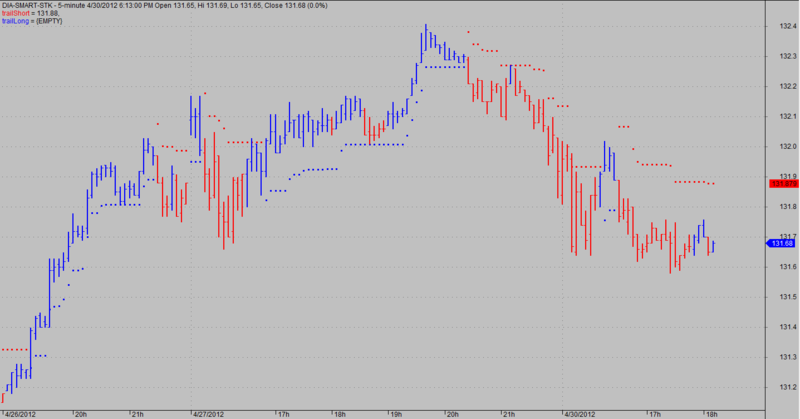
This code produces colored bar almost similar, and sometimes better, than a commercial system sold thousands of dollars. What is provided here is the color coding for bullish/bearis bars, but not the trailing stop, as any volatility stop will work here; there are many who are freely available from amibroker library on the offical site.
Enjoy!
Carl
Screenshots
Similar Indicators / Formulas
Kavach Of Karna v2
Submitted
by hbkwarez almost 12 years ago
Advanced Elliott Waves
Submitted
by MarcosEn over 14 years ago
3_6Day GuaiLiLv
Submitted
by motorfly over 14 years ago
Williams Alligator System
Submitted
by durgesh1712 over 14 years ago
*Level Breakout system*
Submitted
by Tinych over 14 years ago
Horizontal Live Priceline Tool
Submitted
by northstar over 14 years ago
Indicator / Formula
Copy & Paste Friendly
_SECTION_BEGIN("Carl_ASC");
function PercentR( periods )
{
 return -100 * ( HHV( H, periods ) - C )/( HHV( H, periods ) - LLV( L, periods ) );
}

periods= Param("periodes",14,1,100,1);
PR=PercentR( periods );

SetChartOptions(0,chartShowArrows|chartShowDates);
_N(Title = StrFormat("{{NAME}} - {{INTERVAL}} {{DATE}} Open %g, Hi %g, Lo %g, Close %g (%.1f%%) {{VALUES}}", O, H, L, C, SelectedValue( ROC( C, 1 ) ) ));
Plot( C, "Close", IIf(pr>-50,colorBlue,colorRed), styleNoTitle | ParamStyle("Style") | GetPriceStyle() );

if( ParamToggle("Tooltip shows", "All Values|Only Prices" ) )
{
 ToolTip=StrFormat("Open: %g\nHigh:  %g\nLow:   %g\nClose:  %g (%.1f%%)\nVolume: "+NumToStr( V, 1 ), O, H, L, C, SelectedValue( ROC( C, 1 )));
}
_SECTION_END();
4 comments
Leave Comment
Please login here to leave a comment.
Back
CARL,
Help me , please, with “STOP LOSS” formula in your graph.
spintariscop@yahoo.com
Thank You
Carl
Tell me more about your ASC clone,how does it work, please.
Thank you
Dears, so sorry to answer only …6 years after!! I wish there were an option to “subscribe” to a post so you know when somebody posts a comment under your subject. To answer the remarks above: first, thank you for your interest, then: the stop loss is just up to you for the first bars after entry. Personnally I use the last 2 bars extreme to exit quickly. Then, once the gain is a bit higher I will simply exit according to a trailing stop loss, usually the MA. You could also exit when you there is a bar color change AND the next bar breaks the last low (in case of long trader).
Regarding how to enter with this indicator, it is very simple: enter 1 tick above the new blue bar. If you use a volatility stop it is even better to wait for a pullback on the volatility stop line, and providing the color is still blue, enter on the last high + 1 tick. It works well.
You know what they say. Better late then never :)