Stock Portfolio Organizer
The ultimate porfolio management solution.
Shares, Margin, CFD's, Futures and Forex
EOD and Realtime
Dividends and Trust Distributions
And Much More ....
WiseTrader Toolbox
#1 Selling Amibroker Plugin featuring:
Advanced Adaptive Indicators
Advanced Pattern Exploration
Neural Networks
And Much More ....
Pivots for Amibroker (AFL)
Rating:
3 / 5 (Votes 2)
Tags:
amibroker, pivots
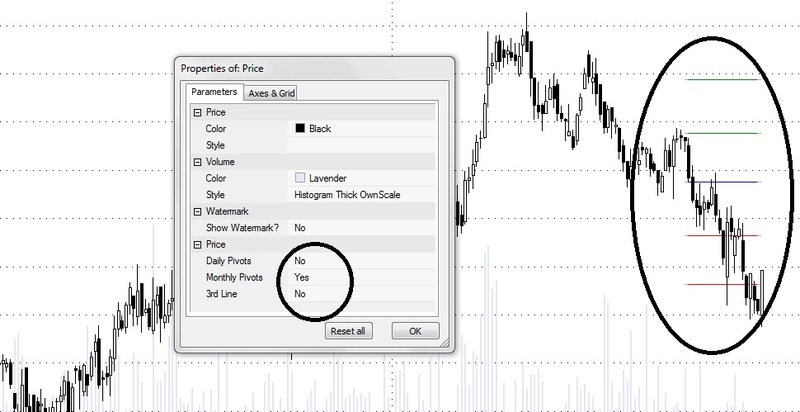
Updated the existing Pivot versions with these -
1. Show pivots to only last 15 bars
2. Show dilay pivots/monthly pivots based on “Yes/No” using properties
3. Show/Hide R3/S3
Screenshots
Similar Indicators / Formulas
Pivots and prices
Submitted
by kaiji over 16 years ago
Tomorrow's pivots
Submitted
by morgen almost 15 years ago
Pivots And Prices And Swing Volume
Submitted
by esnataraj about 16 years ago
Camarilla Pivots
Submitted
by novicetraders about 16 years ago
Pivot Trading All-In-One
Submitted
by kirthi1987 about 16 years ago
Daily, Weekly and Monthly Pivots
Submitted
by sam_u6 about 16 years ago
Indicator / Formula
Copy & Paste Friendly
TimeFrameSet(inDaily);
DayH= LastValue(Ref(H,-1));
DayL= LastValue(Ref(L,-1));
DayC= LastValue(Ref(C,-1));
TimeFrameRestore();

//Daily
PP = (DayL + DayH + DayC)/3;
R1  =  (2 * PP) - DayL;
S1  =  (2 * PP)  - DayH;
R2  =  PP + (DayH - DayL);
S2  =  PP - (DayH - DayL);
R3 = DayH + 2*(PP - DayL);
S3 = DayL - 2*(DayH - PP);

TimeFrameSet(inMonthly);
MonthH= LastValue(Ref(H,-1));
MonthL= LastValue(Ref(L,-1));
MonthC= LastValue(Ref(C,-1));
TimeFrameRestore();

//Monthly
MPP = (MonthL + MonthH + MonthC)/3;
MR1  =  (2 * MPP) - MonthL;
MS1  =  (2 * MPP)  - MonthH;
MR2  =  MPP + (MonthH- MonthL);
MS2  =  MPP - (MonthH- MonthL);
MR3  =  MonthH + 2*(MPP - MonthL);
MS3 =   MonthL - 2*(MonthH- MPP);

SHOWDPIVOTS = ParamToggle("Daily Pivots", "No|Yes",0);
SHOWMPIVOTS = ParamToggle("Monthly Pivots","No|Yes",0);
SHOW3 = ParamToggle("3rd Line", "No|Yes",0);


for (i=BarCount-2;i>(BarCount-13);i--)//set the last bars to the final PP value
{
	PP[i] = PP[BarCount-1];
	R1[i] = R1[BarCount-1];
	R2[i] = R2[BarCount-1];
	S1[i] = S1[BarCount-1];
	S2[i] = S2[BarCount-1];

	ColorG[i] = colorGreen;
	ColorB[i] = colorBlue;
	ColorR[i] = colorRed;
}

//
// Conceal all but the trailing portion of the line
//
for (i=0;i<BarCount-15;i++) //hide the line except most recent 15 bars
{
	ColorR[i] = ColorG[i] = ColorB[i] = colorWhite;
}


if (SHOWDPIVOTS) {
Plot(R2, "R2",ColorG);
Plot(R1, "R1",ColorG);
Plot(PP, "PP",ColorB);
Plot(S1, "S1",ColorR);
Plot(S2, "S2",ColorR);
}

if (SHOWDPIVOTS & SHOW3)
{
		Plot(S3, "S3",ColorR);
		Plot(R3, "R3",ColorG);
}


if (SHOWMPIVOTS) {
Plot(MPP, "MPP",ColorB);
Plot(MR1, "MR1",ColorG);
Plot(MS1, "MS1",ColorR);
Plot(MS2, "MS2",ColorR);
Plot(MR2, "MR2",ColorG);
}

if (SHOWMPIVOTS & SHOW3)
{
		Plot(MR3, "MR3",ColorG);
		Plot(MS3, "MS3",ColorR);
}
0 comments
Leave Comment
Please login here to leave a comment.
Back