Stock Portfolio Organizer
The ultimate porfolio management solution.
Shares, Margin, CFD's, Futures and Forex
EOD and Realtime
Dividends and Trust Distributions
And Much More ....
WiseTrader Toolbox
#1 Selling Amibroker Plugin featuring:
Advanced Adaptive Indicators
Advanced Pattern Exploration
Neural Networks
And Much More ....
Nirvana for Amibroker (AFL)
Rating:
3 / 5 (Votes 7)
Tags:
trading system, amibroker
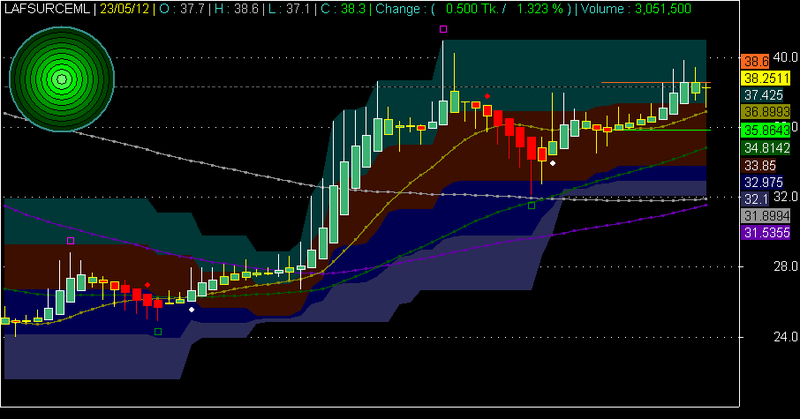
This great Trading System is designed by greatest BD Coder MRTQ13 who is the pioneer of TA in Bangladesh. Actually I am not a cooder but just sharing his invention to all as he has no objection to do so. Definitely it will help all TA. This system is called Nirvana. the circle band shows you all signal for buy/hold/sell. Hope u will enjoy. Hats off to MRTQ13, who inspired me to follow TA technique.
NB: You need to put the “T3_include.afl” in your include Folder of Amibroker…
Screenshots
Similar Indicators / Formulas
All in One
Submitted
by Nahid over 13 years ago
Kase Peak Osc. V2 batu
Submitted
by batu1453 almost 10 years ago
Kase CD V2batu
Submitted
by batu1453 almost 10 years ago
Ichimoku
Submitted
by prashantrdx almost 10 years ago
Arvind' System
Submitted
by akdabc almost 14 years ago
Miftha remix for dse
Submitted
by coolpace over 13 years ago
Indicator / Formula
Copy & Paste Friendly
_SECTION_BEGIN("Forex_Main_mrtq13");
///////////////////////////////////
Title =
EncodeColor(colorWhite)+  Title = Name () + " | "
+EncodeColor(colorYellow) + Date() + " | "

+EncodeColor(colorTurquoise)+ "O : "+ EncodeColor(colorLightGrey)+ O + " | "
+EncodeColor(colorTurquoise)+ "H : "+ EncodeColor(colorLightGrey)+ H + " | "
+EncodeColor(colorTurquoise)+ "L : "+ EncodeColor(colorLightGrey)+ L + " | "
+EncodeColor(colorTurquoise)+ "C : "+ WriteIf(C> Ref(C, -1),EncodeColor(colorBrightGreen),EncodeColor(colorRed))+ C + " | "
+EncodeColor(colorTurquoise)+ "Change : ("+ WriteIf(C> Ref(C, -1),EncodeColor(colorBrightGreen),EncodeColor(colorRed)) + WriteVal(C-Ref(C,-1))+" Tk."
+EncodeColor(colorTurquoise)+ " /"+ WriteIf(C> Ref(C, -1),EncodeColor(colorBrightGreen),EncodeColor(colorRed))+ WriteVal( ROC( C, 1 ))+""+ " % "
+EncodeColor(colorTurquoise)+ ") | Volume : " + WriteIf(V> Ref(V, -1),EncodeColor(colorBrightGreen),EncodeColor(colorRed))+ WriteVal(V,1)
;

_SECTION_END();

_SECTION_BEGIN("Haiken");

Show_color = ParamToggle("Display CandleColor", "No|Yes", 1);
r1 =5; //Param( "ColorFast avg", 5, 2, 200, 1 );
r2 =10; //Param( "ColorSlow avg", 10, 2, 200, 1 );
r3 =5; //Param( "ColorSignal avg", 5, 2, 200, 1 );

Prd1=4; //Param("ATR Period",4,1,20,1);
Prd2=7; //Param("Look Back",7,1,20,1);
green = HHV(LLV(L,Prd1)+ATR(Prd1),Prd2);
red = LLV(HHV(H,Prd1)-ATR(Prd1),Prd2);

HaClose =EMA((O+H+L+C)/4,3);  // Woodie
//HaClose =(O+H+L+C)/4;
HaOpen = AMA( Ref( HaClose, -1 ), 0.5 );
HaHigh = Max( H, Max( HaClose, HaOpen ) );
HaLow = Min( L, Min( HaClose, HaOpen ) );
//HaClose = ( HaClose + HaOpen + HaHigh + HaLow )/4; // // Velvoort is using not original, but modified Heikin-Ashi close
Temp = Max(High, HaOpen);
Temp = Min(Low,HaOpen);


m1=MACD(r1,r2);
s1=Signal(r1,r2,r3);
mycolor=IIf(m1<0 AND m1>s1, ColorRGB(230,230,0),IIf(m1>0 AND m1>s1,colorBrightGreen,IIf(m1>0 AND m1<s1,colorOrange,colorDarkRed)));

if(Show_color)

{
ColorHighliter = myColor;
SetBarFillColor( ColorHighliter );


}

//////////
m1=MACD(r1,r2);
s1=Signal(r1,r2,r3);
mycolor=IIf(m1<0 AND m1>s1, ColorRGB(230,230,0),IIf(m1>0 AND m1>s1,colorWhite,IIf(m1>0 AND m1<s1,colorOrange,colorDarkRed)));
if(Show_color)

{
ColorHighliter = mycolor;
SetBarFillColor( ColorHighliter );
}

barColor=IIf(C>Green ,colorWhite,IIf(C < RED,colorRed,colorYellow));
barColor2=IIf(Close > Open, colorWhite, colorRed);


if( ParamToggle("Plot Normal Candle", "No,Yes", 1 ) )
  PlotOHLC( HaOpen, HaHigh, HaLow, HaClose, " " , barcolor, styleCandle | styleThick );
else
PlotOHLC( Open, High, Low, Close, " " , barcolor2, styleCandle | styleThick );

_SECTION_END();

_SECTION_BEGIN("Breakout Setting");
Buyperiods=Param("Breakout periods best is usually 18",5,1,100,1,1);
Sellperiods=Param("Exit Breakout",5,1,100,1,1);
Buy= C>Ref(HHV(High,Buyperiods),-1);
Sell= C<Ref(LLV(Low,Sellperiods),-1);

/* exrem is one method to remove surplus strade signals. It removes excessive signals of arrow */
Buy = ExRem(Buy, Sell);
Sell = ExRem(Sell, Buy);
PlotShapes( IIf( Buy, shapeSmallCircle, shapeNone ), colorWhite, layer = 0,yposition = HaLow, offset = -10);
//PlotShapes( IIf( Buy, shapeSmallCircle, shapeNone ), colorWhite, layer = 0,yposition = HaLow, offset = -8);


PlotShapes( IIf( Sell, shapeSmallCircle, shapeNone ), colorRed, layer = 0, yposition = HaHigh, offset = 10);
//PlotShapes( IIf( Sell, shapeSmallCircle, shapeNone ), colorRed, layer = 0, yposition = HaHigh, offset = 8);


_SECTION_END();

_SECTION_BEGIN("Pivot Box");
Hi=Param("High_Period",7,1,50,1);
Lo=Param("Low_Period",7,1,50,1);
A1=ExRemSpan(Ref(High,-2)==HHV(High,Hi),3);
A2=ExRemSpan(Ref(Low,-2)==LLV(Low,Lo),3);
A3=Cross(A1,0.9);
A4=Cross(A2,0.9);
TOP=Ref(HaHigh,-BarsSince(A3));


breakoutLine=Param("BrOutLineLength",10,2,30,0.1);
upDaysback1    = breakoutLine;
upFirstBar1    = BarCount - upDaysBack1;
upst2=TOP;

upYYY2=IIf(BarIndex() >= upFirstbar1,EndValue(upSt2),Null);

Plot(upYYY2,"",ParamColor("BreakoutColor", colorOrange) ,ParamStyle("BreakoutLine",styleLine|styleThick|styleStaircase,maskAll));
//Plot(top,"",11,styleDots+styleLine+styleThick);


bot=Ref(HaLow,-BarsSince(A4));
breakDownLine=Param("BrDownLineLength",10,2,30,0.1);
dnDaysback1    = breakDownLine;
dnFirstBar1    = BarCount - dnDaysBack1;
dnst2=BOT;

dnYYY2=IIf(BarIndex() >= dnFirstbar1,EndValue(dnSt2),Null);


Plot(dnYYY2,"",ParamColor("BreakDownColor", colorBrightGreen) ,ParamStyle("BreakdownLine",styleLine|styleThick|styleStaircase,maskAll));
//Plot(bot,"",6,styleDots+styleLine);
_SECTION_END();

function T3(price,periods)
{
	s = 0.84;
	e1=EMA(price,periods);
	e2=EMA(e1,Periods);
	e3=EMA(e2,Periods);
	e4=EMA(e3,Periods);
	e5=EMA(e4,Periods);
	e6=EMA(e5,Periods);
	c1=-s*s*s;
	c2=3*s*s+3*s*s*s;
	c3=-6*s*s-3*s-3*s*s*s;
	c4=1+3*s+s*s*s+3*s*s;
	Ti3=c1*e6+c2*e5+c3*e4+c4*e3;
	return ti3;
}


//**********************************************************************************
//        Plot price horizontal line                                               *
//**********************************************************************************/
_SECTION_BEGIN("Price Line");

PriceLineColor=colorGrey40; //ParamColor("PriceLineColor",ColorRGB(82,82,82));
PriceLevel = ParamField("PriceField", field = 3 );

Daysback    = Param("Bars Back",500,10,900,1);
FirstBar    = BarCount - DaysBack;
YY          = IIf(BarIndex() >= Firstbar,EndValue(PriceLevel),Null);

Plot(YY,"Current Price",PriceLineColor,ParamStyle("LineStyle",styleLine|styleDashed|styleNoTitle|styleNoLabel|styleThick,maskAll));

_SECTION_END();


_SECTION_BEGIN("Average 0");
//Average_switch = ParamToggle("Candle On/off", "Off|On");
P = HaClose;
Type = ParamList("Type", "Weighted,Lagless-21,Hull-26,Linear
Regression-45,Exponential,Double Exponential,Tripple
Exponential,Wilders,Simple");
Periods = Param("Periods", 20, 2, 200 );
Displacement = Param("Displacement", 1, -50, 50 );
m = 0;

if( Type == "Weighted" ) 				m=  WMA( P, Periods );
if( Type == "Lagless-21"  )				m=  2*EMA(P, Periods)-EMA(EMA(P, Periods),
Periods);
if( Type == "Hull-26"  )				m=  WMA(2*(WMA(P, Periods/2))-WMA(P, Periods) ,4
);
if( Type == "Linear Regression-45"  ) m=  LinearReg( P, Periods );
if( Type == "Exponential" ) 			m = EMA( P, Periods );
if( Type == "Double Exponential" ) 	m = DEMA( P, Periods );
if( Type == "Tripple Exponential" ) 	m = TEMA( P, Periods );
if( Type == "Wilders" ) 				m = Wilders( P, Periods );
if( Type == "Simple" ) 					m = MA( P, Periods );

Plot( m, _DEFAULT_NAME(), ParamColor("Color", colorDarkYellow),ParamStyle("Style",styleLine |styleThick|styleDots|styleNoTitle ,maskAll),Displacement );

_SECTION_END();


_SECTION_BEGIN("Average 1");
//Average_switch = ParamToggle("Candle On/off", "Off|On");
P = HaClose;
Type = ParamList("Type", "Weighted,Lagless-21,Hull-26,Linear
Regression-45,Exponential,Double Exponential,Tripple
Exponential,Wilders,Simple");
Periods = Param("Periods", 60, 2, 200 );
Displacement = Param("Displacement", 1, -50, 50 );
m = 0;

if( Type == "Weighted" ) 				m=  WMA( P, Periods );
if( Type == "Lagless-21"  )				m=  2*EMA(P, Periods)-EMA(EMA(P, Periods),
Periods);
if( Type == "Hull-26"  )				m=  WMA(2*(WMA(P, Periods/2))-WMA(P, Periods) ,4
);
if( Type == "Linear Regression-45"  ) m=  LinearReg( P, Periods );
if( Type == "Exponential" ) 			m = EMA( P, Periods );
if( Type == "Double Exponential" ) 	m = DEMA( P, Periods );
if( Type == "Tripple Exponential" ) 	m = TEMA( P, Periods );
if( Type == "Wilders" ) 				m = Wilders( P, Periods );
if( Type == "Simple" ) 					m = MA( P, Periods );

Plot( m, _DEFAULT_NAME(), ParamColor("Color", colorDarkGreen),ParamStyle("Style",styleLine |styleThick|styleDots|styleNoTitle ,maskAll),Displacement );

_SECTION_END();

_SECTION_BEGIN("Average 2");
//Average_switch = ParamToggle("Candle On/off", "Off|On");
P = HaClose;
Type = ParamList("Type", "Weighted,Lagless-21,Hull-26,Linear
Regression-45,Exponential,Double Exponential,Tripple
Exponential,Wilders,Simple");
Periods = Param("Periods", 100, 2, 200 );
Displacement = Param("Displacement", 1, -50, 50 );
m = 0;

if( Type == "Weighted" ) 				m=  WMA( P, Periods );
if( Type == "Lagless-21"  )				m=  2*EMA(P, Periods)-EMA(EMA(P, Periods),
Periods);
if( Type == "Hull-26"  )				m=  WMA(2*(WMA(P, Periods/2))-WMA(P, Periods) ,4
);
if( Type == "Linear Regression-45"  ) m=  LinearReg( P, Periods );
if( Type == "Exponential" ) 			m = EMA( P, Periods );
if( Type == "Double Exponential" ) 	m = DEMA( P, Periods );
if( Type == "Tripple Exponential" ) 	m = TEMA( P, Periods );
if( Type == "Wilders" ) 				m = Wilders( P, Periods );
if( Type == "Simple" ) 					m = MA( P, Periods );

Plot( m, _DEFAULT_NAME(), ParamColor("Color", ColorRGB(70,70,70)),ParamStyle("Style",styleLine |styleThick|stylehidden|styleDots|styleNoTitle ,maskAll),Displacement );

_SECTION_END();


_SECTION_BEGIN("Average 5");
P = HaClose;
Type = ParamList("Type", "Weighted,Lagless-21,Hull-26,Linear
Regression-45,Exponential,Double Exponential,Tripple
Exponential,Wilders,Simple");
Periods = Param("Periods", 120 ,2, 200 );
Displacement = Param("Displacement", 1, -50, 50 );
m = 0;

if( Type == "Weighted" ) 				m=  WMA( P, Periods );
if( Type == "Lagless-21"  )				m=  2*EMA(P, Periods)-EMA(EMA(P, Periods),
Periods);
if( Type == "Hull-26"  )				m=  WMA(2*(WMA(P, Periods/2))-WMA(P, Periods) ,4
);
if( Type == "Linear Regression-45"  ) m=  LinearReg( P, Periods );
if( Type == "Exponential" ) 			m = EMA( P, Periods );
if( Type == "Double Exponential" ) 	m = DEMA( P, Periods );
if( Type == "Tripple Exponential" ) 	m = TEMA( P, Periods );
if( Type == "Wilders" ) 				m = Wilders( P, Periods );
if( Type == "Simple" ) 					m = MA( P, Periods );

Plot( m, _DEFAULT_NAME(), ParamColor("Color", colorCustom13),ParamStyle("Style",styleLine |styleThick|styleDots|styleNoTitle ,maskAll),Displacement );
_SECTION_END();


_SECTION_BEGIN("Sell Average 3");
P = HaClose;
Type = ParamList("Type", "Weighted,Lagless-21,Hull-26,Linear
Regression-45,Exponential,Double Exponential,Tripple
Exponential,Wilders,Simple");
Periods = Param("Periods", 180, 2, 800 );
Displacement = Param("Displacement", 1, -50, 50 );
m = 0;

if( Type == "Weighted" ) 				m=  WMA( P, Periods );
if( Type == "Lagless-21"  )				m=  2*EMA(P, Periods)-EMA(EMA(P, Periods),
Periods);
if( Type == "Hull-26"  )				m=  WMA(2*(WMA(P, Periods/2))-WMA(P, Periods) ,4
);
if( Type == "Linear Regression-45"  ) m=  LinearReg( P, Periods );
if( Type == "Exponential" ) 			m = EMA( P, Periods );
if( Type == "Double Exponential" ) 	m = DEMA( P, Periods );
if( Type == "Tripple Exponential" ) 	m = TEMA( P, Periods );
if( Type == "Wilders" ) 				m = Wilders( P, Periods );
if( Type == "Simple" ) 					m = MA( P, Periods );

Plot( m, _DEFAULT_NAME(), ParamColor("Color", ColorRGB(150,150,150)),ParamStyle("Style",styleLine |styleThick|styleDots|styleNoTitle ,maskAll),Displacement );
_SECTION_END();


_SECTION_BEGIN("Average 4");
P = HaClose;
Type = ParamList("Type", "Weighted,Lagless-21,Hull-26,Linear
Regression-45,Exponential,Double Exponential,Tripple
Exponential,Wilders,Simple");
Periods = Param("Periods", 500, 2, 800 );
Displacement = Param("Displacement", 1, -50, 50 );
m = 0;

if( Type == "Weighted" ) 				m=  WMA( P, Periods );
if( Type == "Lagless-21"  )				m=  2*EMA(P, Periods)-EMA(EMA(P, Periods),
Periods);
if( Type == "Hull-26"  )				m=  WMA(2*(WMA(P, Periods/2))-WMA(P, Periods) ,4
);
if( Type == "Linear Regression-45"  ) m=  LinearReg( P, Periods );
if( Type == "Exponential" ) 			m = EMA( P, Periods );
if( Type == "Double Exponential" ) 	m = DEMA( P, Periods );
if( Type == "Tripple Exponential" ) 	m = TEMA( P, Periods );

Plot( m, _DEFAULT_NAME(), ParamColor("Color", ColorRGB(190,190,190)),ParamStyle("Style",styleLine |styleThick|stylehidden|styleDots|styleNoTitle ,maskAll),Displacement );
_SECTION_END();


_SECTION_BEGIN("Bands_Short");
BandDays= Param("DaysBack",40,10,900,1);
HighestHigh = HHV( H, BandDays ) ;
LowestLow = LLV( L, BandDays) ;

KS = ( HHV( H, BandDays ) + LLV( L, BandDays) )/2;

//Plot(HighestHigh ,"HighestHigh ",colorBlue,styleLine | styleStaircase|styleNoRescale| styleNoLabel|styleNoTitle );
//Plot(LowestLow ,"LowestLow ",colorRed,styleLine | styleStaircase );
//Plot(KS,"KS",colorGreen,styleLine |styleThick | styleStaircase );

//Plot((KS+HighestHigh )/2,"",colorYellow, styleLine |  styleThick | styleStaircase );
//Plot((KS+LowestLow )/2,"",colorYellow, styleLine |  styleThick | styleStaircase );


CloudUpColor1=ParamColor("ShortupColor1",ColorRGB(0,55,55));
CloudUpColor2=ParamColor("ShortupColor2",ColorRGB(60,15,0));
CloudDownColor1=ParamColor("ShortDnColor1",ColorRGB(0,0,83));
CloudDownColor2= ParamColor("ShortDnColor2",ColorRGB(43,43,89));

CU1=HighestHigh;
CU2=(KS+HighestHigh )/2;

CD1=LowestLow = LLV( L, 22) ;
CD2=(KS+LowestLow )/2;


PlotOHLC( CU1, CU1,CU2,CU2, "", CloudUpColor1, styleCloud || styleStaircase|styleNoRescale| styleNoLabel|styleNoTitle );
PlotOHLC( CU2, CU2,KS,KS, "", CloudUpColor2, styleCloud || styleStaircase|styleNoRescale| styleNoLabel|styleNoTitle );

PlotOHLC( KS, KS,CD2,CD2, "", CloudDownColor1, styleCloud || styleStaircase|styleNoRescale| styleNoLabel|styleNoTitle );
PlotOHLC( CD2, CD2,CD1,CD1, "", CloudDownColor2, styleCloud || styleStaircase|styleNoRescale| styleNoLabel|styleNoTitle );


_SECTION_END();

_SECTION_BEGIN("Bands_Long");

SupResB = Param("Sup-Res Short",30,0,100,1);
//SupResB2 = Param("Sup-Res Short2",12,0,100,1);
SupResC=Param("Res Long",160,0,350,1);
ResL=Param("SupLong",60,0,350,1);

nn=SupResB;


nn2=SupResC;
nn3=ResL;

Hh=HHV(HaHigh,nn);
Ll=LLV(HaLow,nn);

Hh2=HHV(HaHigh,nn2);
L2=LLV(HaLow,nn3);


//Plot(Hh2,"",ColorRGB(13,32,29),ParamStyle("LongResLine",styleLine|styleStaircase|styleNoRescale |styleNoTitle|styleNoLabel|styleThick,maskAll));


//Plot(L2,"",ColorRGB(12,12,52),ParamStyle("LongSupLine",styleLine|styleStaircase|styleNoRescale |styleNoTitle|styleNoLabel|styleThick,maskAll));


_SECTION_END();

_SECTION_BEGIN("Cloud Setting Long");
//Cloud

ParmCloud = ParamToggle("CloudLong", "No|Yes", 1);

CloudResColor=ParamColor("CloudResColorLong",colorDarkGrey);
BrCount7=Param("CloudResLengthLong",300,1,500,1);
for (i=0;i<BarCount-BrCount7;i++) //hide the line except most recent 10 bars
{
	CloudResColor[i] = colorBlack;
}


CS1=LLV(HaLow,nn3);
CR1=HHV(HaHigh,nn2);


if(parmCloud == 1)
{
	PlotOHLC( CS1, CS1, CR1,CR1, "", CloudResColor, styleCloud |styleStaircase| styleNoLabel|styleNoRescale |styleNoTitle);
}

_SECTION_END();


_SECTION_BEGIN("Pivot");
nBars = Param("Number of bars", 25, 5, 40);
LP=Param("LookBack Period",250,1,500,1);
bShowTCZ = Param("Show TCZ", 0, 0, 1);
nExploreBarIdx = 0;
nExploreDate = 0;
nCurDateNum = 0;
DN = DateNum();
DT = DateTime();
bTCZLong = False;
bTCZShort = False;
nAnchorPivIdx = 0;
ADX8 = ADX(8);
if(Status("action")==1) {
	bDraw = True;
	bUseLastVis = 1;
} else {
	bDraw = False;
	bUseLastVis = False;
	bTrace = 1;
	nExploreDate = Status("rangetodate");
	for (i=LastValue(BarIndex());i>=0;i--) {
		nCurDateNum = DN[i];
		if (nCurDateNum == nExploreDate) {
			nExploreBarIdx = i;
		}
	}
}
GraphXSpace=7;
if (bDraw) {
}
aHPivs = H - H;
aLPivs = L - L;
aHPivHighs = H - H;
aLPivLows = L - L;
aHPivIdxs = H - H;
aLPivIdxs = L - L;
aAddedHPivs = H - H;
aAddedLPivs = L - L;
aLegVol = H - H;
aRetrcVol = H - H;
nHPivs = 0;
nLPivs = 0;
lastHPIdx = 0;
lastLPIdx = 0;
lastHPH = 0;
lastLPL = 0;
curPivBarIdx = 0;
aHHVBars = HHVBars(H, nBars);
aLLVBars = LLVBars(L, nBars);
aHHV = HHV(H, nBars);
aLLV = LLV(L, nBars);
nLastVisBar = LastValue(
	Highest(IIf(Status("barvisible"), BarIndex(), 0)));
curBar = IIf(nlastVisBar > 0 AND bUseLastVis, nlastVisBar,
	IIf(Status("action")==4 AND nExploreBarIdx > 0, nExploreBarIdx,
	LastValue(BarIndex())));
curTrend = "";
if (aLLVBars[curBar] < aHHVBars[curBar])
	curTrend = "D";
else
	curTrend = "U";
if (curBar >= LP) {
	for (i=0; i<LP; i++) {
		curBar = IIf(nlastVisBar > 0 AND bUseLastVis,
			nlastVisBar-i,
			IIf(Status("action")==4 AND nExploreBarIdx > 0,
			nExploreBarIdx-i,
			LastValue(BarIndex())-i));
		if (aLLVBars[curBar] < aHHVBars[curBar]) {
			if (curTrend == "U") {
				curTrend = "D";
				curPivBarIdx = curBar - aLLVBars[curBar];
				aLPivs[curPivBarIdx] = 1;
				aLPivLows[nLPivs] = L[curPivBarIdx];
				aLPivIdxs[nLPivs] = curPivBarIdx;
				nLPivs++;
			}
		} else {
			if (curTrend == "D") {
				curTrend = "U";
				curPivBarIdx = curBar - aHHVBars[curBar];
				aHPivs[curPivBarIdx] = 1;
				aHPivHighs[nHPivs] = H[curPivBarIdx];
				aHPivIdxs[nHPivs] = curPivBarIdx;
				nHPivs++;
			}
		}
	}
}
curBar =
	IIf(nlastVisBar > 0 AND bUseLastVis,
	nlastVisBar,
	IIf(Status("action")==4 AND nExploreBarIdx > 0,
	nExploreBarIdx,
	LastValue(BarIndex()))
	);
if (nHPivs >= 2 AND nLPivs >= 2) {
	lastLPIdx = aLPivIdxs[0];
	lastLPL = aLPivLows[0];
	lastHPIdx = aHPivIdxs[0];
	lastHPH = aHPivHighs[0];
	nLastHOrLPivIdx = Max(lastLPIdx, lastHPIdx);
	nAddPivsRng = curBar - nLastHOrLPivIdx;
	aLLVAfterLastPiv = LLV(L, nAddPivsRng);
	nLLVAfterLastPiv = aLLVAfterLastPiv[curBar];
	aLLVIdxAfterLastPiv = LLVBars(L, nAddPivsRng);
	nLLVIdxAfterLastPiv = curBar - aLLVIdxAfterLastPiv[curBar];
	aHHVAfterLastPiv = HHV(H, nAddPivsRng);
	nHHVAfterLastPiv = aHHVAfterLastPiv[curBar];
	aHHVIdxAfterLastPiv = HHVBars(H, nAddPivsRng);
	nHHVIdxAfterLastPiv = curBar - aHHVIdxAfterLastPiv[curBar];
	if (lastHPIdx > lastLPIdx) {

		/*	There are at least two possibilities here. One is that
	   		the previous high was higher, indicating that this is a
	   		possible short retracement or one in the making.
	   		The other is that the previous high was lower, indicating
	   		that this is a possible long retracement in the working.
			However, both depend on opposing pivots. E.g., if I find
			higher highs, what if I have lower lows?

			If the highs are descending, then I can consider:
	   			- a lower low, and leave it at that
	   			- a higher high and higher low
	   			- a lower low and another lower high
		*/
		if (aHPivHighs[0] < aHPivHighs[1]) {

			if (nLLVAfterLastPiv < aLPivLows[0] AND
				(nLLVIdxAfterLastPiv - lastHPIdx - 1) >= 1
				AND nLLVIdxAfterLastPiv != curBar	) {

				// -- OK, we'll add this as a pivot.
				//    Mark it for plotting...
				aLPivs[nLLVIdxAfterLastPiv] = 1;
				aAddedLPivs[nLLVIdxAfterLastPiv] = 1;

				//    ...and then rearrange elements in the
				//    pivot information arrays
				for (j=0; j<nLPivs; j++) {
					aLPivLows[nLPivs-j] = aLPivLows[nLPivs-(j+1)];
					aLPivIdxs[nLPivs-j] = aLPivIdxs[nLPivs-(j+1)];
				}
				aLPivLows[0] = nLLVAfterLastPiv;
				aLPivIdxs[0] = nLLVIdxAfterLastPiv;
				nLPivs++;

			// -- Test whether to add piv given last piv is high
			//    AND we have lower highs
			}

		// -- Here, the last piv is a high piv, and we have
		//    higher-highs. The most likely addition is a
		//    Low piv that is a retracement.
		} else {

			if (nLLVAfterLastPiv > aLPivLows[0] AND
				(nLLVIdxAfterLastPiv - lastHPIdx - 1) >= 1
				AND nLLVIdxAfterLastPiv != curBar	) {

				// -- OK, we'll add this as a pivot.
				//    Mark it for plotting...
				aLPivs[nLLVIdxAfterLastPiv] = 1;
				aAddedLPivs[nLLVIdxAfterLastPiv] = 1;

				//    ...and then rearrange elements in the
				//    pivot information arrays
				for (j=0; j<nLPivs; j++) {
					aLPivLows[nLPivs-j] = aLPivLows[nLPivs-(j+1)];
					aLPivIdxs[nLPivs-j] = aLPivIdxs[nLPivs-(j+1)];
				}
				aLPivLows[0] = nLLVAfterLastPiv;
				aLPivIdxs[0] = nLLVIdxAfterLastPiv;
				nLPivs++;

			// -- Test whether to add piv given last piv is high
			//    AND we have lower highs
			}
		// -- The last piv is a high and we have higher highs
		//    OR lower highs
		}

	/* ****************************************************************
		Still finding missed pivot(s). Here, the last piv is a low piv.
	**************************************************************** */
	} else {

		// -- First case, lower highs
		if (aHPivHighs[0] < aHPivHighs[1]) {

			if (nHHVAfterLastPiv < aHPivHighs[0] AND
				(nHHVIdxAfterLastPiv - lastLPIdx - 1) >= 1
				AND nHHVIdxAfterLastPiv != curBar	) {

				// -- OK, we'll add this as a pivot.
				//    Mark that for plotting
				aHPivs[nHHVIdxAfterLastPiv] = 1;
				aAddedHPivs[nHHVIdxAfterLastPiv] = 1;

				//    ...and then rearrange elements in the
				//    pivot information arrays
				for (j=0; j<nHPivs; j++) {
					aHPivHighs[nHPivs-j] = aHPivHighs[nHPivs-(j+1)];
					aHPivIdxs[nHPivs-j] = aHPivIdxs[nhPivs-(j+1)];
				}
				aHPivHighs[0] = nHHVAfterLastPiv;
				aHPivIdxs[0] = nHHVIdxAfterLastPiv;
				nHPivs++;

			// -- Test whether to add piv given last piv is high
			//    AND we have lower highs
			}

		// -- Second case when last piv is a low piv, higher highs
		//    Most likely addition is high piv that is a retracement.
		//    Considering adding a high piv as long as it is higher
		} else {

			// -- Where I have higher highs,
			if (nHHVAfterLastPiv > aHPivHighs[0] AND
				(nHHVIdxAfterLastPiv - lastLPIdx - 1) >= 1
				AND nHHVIdxAfterLastPiv != curBar	) {

				// -- OK, we'll add this as a pivot.
				//    Mark it for plotting...
				aHPivs[nHHVIdxAfterLastPiv] = 1;
				aAddedHPivs[nHHVIdxAfterLastPiv] = 1;

				//    ...and then rearrange elements in the
				//    pivot information arrays
				for (j=0; j<nHPivs; j++) {
					aHPivHighs[nHPivs-j] = aHPivHighs[nHPivs-(j+1)];
					aHPivIdxs[nHPivs-j] = aHPivIdxs[nhPivs-(j+1)];
				}
				aHPivHighs[0] = nHHVAfterLastPiv;
				aHPivIdxs[0] = nHHVIdxAfterLastPiv;
				nHPivs++;

			// -- Test whether to add piv given last piv is high
			//    AND we have lower highs
			}

		}

	}

// -- If there are at least two of each
}

/* ****************************************
// -- Done with finding pivots
***************************************** */


if (bDraw) {

	// -- OK, let's plot the pivots using arrows

/*PlotShapes( IIf(aHPivs==1, shapeHollowSmallSquare, shapeNone), colorRed, layer = 0, yposition = HaHigh, offset = 10);
PlotShapes( IIf(aHPivs==1, shapeSmallCircle, shapeNone), colorRed, layer = 0, yposition = HaHigh, offset = 10);


PlotShapes( IIf(aAddedLPivs==1,  shapeHollowSmallSquare, shapeNone), colorYellow, layer = 0, yposition = HaLow, offset = -10);
PlotShapes( IIf(aAddedLPivs==1, shapeSquare, shapeNone), colorBlack, layer = 0, yposition = HaLow, offset = -14);


//PlotShapes( IIf(aAddedLPivs==1, shapeSmallCircle, shapeNone), colorYellow, layer = 0, yposition = HaLow, offset = -9);*/


//PlotShapes( IIf(aHPivs==1, shapeSmallCircle, shapeNone), colorCustom12, layer = 0, yposition = HaHigh, offset = 9);
PlotShapes( IIf(aHPivs==1, shapeHollowSmallSquare, shapeNone), colorCustom12, layer = 0, yposition = HaHigh, offset = 12);

//PlotShapes( IIf(aAddedHPivs==1, shapeSmallCircle, shapeNone), colorCustom10,layer = 0, yposition = HaHigh, offset = 9);
PlotShapes( IIf(aAddedHPivs==1, shapeHollowSmallSquare, shapeNone), colorYellow, layer = 0, yposition = HaHigh, offset = 12);

//PlotShapes( IIf(aLPivs==1, shapeSmallCircle, shapeNone), colorPaleGreen, layer = 0, yposition = HaLow, offset = -9);
PlotShapes( IIf(aLPivs==1, shapeHollowSmallSquare, shapeNone), colorGreen, layer = 0, yposition = HaLow, offset = -12);

//PlotShapes( IIf(aAddedLPivs==1, shapeSmallCircle, shapeNone), colorYellow, layer = 0, yposition = HaLow, offset = -10);
PlotShapes( IIf(aAddedLPivs==1, shapeHollowSmallSquare, shapeNone), colorYellow, layer = 0, yposition = HaLow, offset = -13);

}


/* ****************************************
// -- Done with discovering and plotting pivots
***************************************** */

// -- I'm going to want to look for possible retracement
risk = 0;
profInc = 0;
nLeg0Pts = 0;
nLeg0Bars = 0;
nLeg0Vol = 0;
nLeg1Pts = 0;
nLeg1Bars = 0;
nLeg1Vol = 0;
nLegBarsDiff = 0;
nRtrc0Pts = 0;
nRtrc0Bars = 0;
nRtrc0Vol = 0;
nRtrc1Pts = 0;
nRtrc1Bars = 0;
nRtrc1Vol = 0;

minRtrc = 0;
maxRtrc = 0;
minLine = 0;
maxLine = 0;
triggerLine = 0;
firstProfitLine = 0;
triggerInc = 0;
triggerPrc = 0;
firstProfitPrc = 0;
retrcPrc = 0;
retrcBar = 0;
retrcBarIdx = 0;
retrcRng = 0;
aRetrcPrc = H-H;
aRetrcPrcBars = H-H;
aRetrcClose = C;
retrcClose = 0;

// -- Do TCZ calcs. Arrangement of pivs very specific
//    for this setup.
if (nHPivs >= 2 AND
	nLPivs >=2 AND
	aHPivHighs[0] > aHPivHighs[1] AND
	aLPivLows[0] > aLPivLows[1]) {

	tcz500 =
	(aHPivHighs[0] -
	(.5 * (aHPivHighs[0] - aLPivLows[1])));

	tcz618 =
	(aHPivHighs[0] -
	(.618 * (aHPivHighs[0] - aLPivLows[1])));

	tcz786 =
	(aHPivHighs[0] -
	(.786 * (aHPivHighs[0] - aLPivLows[0])));

	retrcRng = curBar  - aHPivIdxs[0];
	aRetrcPrc = LLV(L, retrcRng);
	aRetrcPrcBars  = LLVBars(L, retrcRng);

	retrcPrc = aRetrcPrc[curBar];
	retrcBarIdx = curBar - aRetrcPrcBars[curBar];
	retrcClose = aRetrcClose[retrcBarIdx];

	// -- bTCZLong setup?
	bTCZLong = (

		// -- Are retracement levels arranged in
		//    tcz order?

		// .500 is above .786 for long setups
		tcz500 >= (tcz786 * (1 - .005))
		AND
		// .681 is below .786 for long setups
		tcz618 <= (tcz786 * (1 + .005))
		AND

		// -- Is the low in the tcz range
		// -- Is the close >= low of tcz range
		//    and low <= high of tcz range
		retrcClose >= ((1 - .01) *  tcz618)
		AND
		retrcPrc <= ((1 + .01) *  tcz500)
		);

		// -- risk would be high of signal bar minus low of zone
		//risk = 0;

// -- lower highs and lower lows
} else if (nHPivs >= 2 AND nLPivs >=2
	AND aHPivHighs[0] < aHPivHighs[1]
	AND aLPivLows[0] < aLPivLows[1]) {

	tcz500 =
	(aHPivHighs[1] -
	(.5 * (aHPivHighs[1] - aLPivLows[0])));

	tcz618 =
	(aHPivHighs[0] -
	(.618 * (aHPivHighs[1] - aLPivLows[0])));

	tcz786 =
	(aHPivHighs[0] -
	(.786 * (aHPivHighs[0] - aLPivLows[0])));

	retrcRng = curBar  - aLPivIdxs[0];
	aRetrcPrc = HHV(H, retrcRng);
	retrcPrc = aRetrcPrc[curBar];
	aRetrcPrcBars  = HHVBars(H, retrcRng);
	retrcBarIdx = curBar - aRetrcPrcBars[curBar];
	retrcClose = aRetrcClose[retrcBarIdx];

	bTCZShort = (
		// -- Are retracement levels arranged in
		//    tcz order?

		// .500 is below .786 for short setups
		tcz500 <= (tcz786 * (1 + .005))
		AND
		// .681 is above .786 for short setups
		tcz618 >= (tcz786 * (1 - .005))
		AND

		// -- Is the close <= high of tcz range
		//    and high >= low of tcz range
		retrcClose <= ((1 + .01) *  tcz618)
		AND
		retrcPrc >= ((1 - .01) *  tcz500)
		);

		// -- Risk would be top of zone - low of signal bar
		//risk = 0;
}

// -- Show zone if present
if (bTCZShort OR bTCZLong) {

	// -- Be prepared to see symmetry
	if (bTCZShort) {
		if (aLPivIdxs[0] > aHPivIdxs[0]) {
			// -- Valuable, useful symmetry information
			nRtrc0Pts = aHPivHighs[0] - aLPivLows[1];
			nRtrc0Bars = aHPivIdxs[0] - aLPivIdxs[1] + 1;
			nRtrc1Pts = retrcPrc - aLPivLows[0];
			nRtrc1Bars = retrcBarIdx - aLPivIdxs[0] + 1;
		} else {
			nRtrc0Pts = aHPivHighs[1] - aLPivLows[1];
			nRtrc0Bars = aHPivIdxs[1] - aLPivIdxs[1] + 1;
			nRtrc1Pts = aHPivHighs[0] - aLPivLows[0];
			nRtrc1Bars = aHPivIdxs[0] - aLPivIdxs[0] + 1;
		}
	} else { // bLongSetup
		if (aLPivIdxs[0] > aHPivIdxs[0]) {
			nRtrc0Pts = aHPivHighs[0] - aLPivLows[1];
			nRtrc0Bars = aHPivIdxs[0] - aLPivIdxs[1] + 1;
			nRtrc1Pts = retrcPrc - aLPivLows[0];
			nRtrc1Bars = retrcBarIdx - aLPivIdxs[0] + 1;
		} else {
			nRtrc0Pts = aHPivHighs[1] - aLPivLows[0];
			nRtrc0Bars = aLPivIdxs[0] - aHPivIdxs[1] + 1;
			nRtrc1Pts = aHPivHighs[0] - aLPivLows[0];
			nRtrc1Bars = aLPivIdxs[0] - aHPivIdxs[0] + 1;
		}
	}

	if (bShowTCZ) {
		Plot(
			LineArray(	IIf(bTCZLong, aHPivIdxs[0], aLPivIdxs[0]),
			tcz500, curBar, tcz500 , 0),
			"tcz500", colorPaleBlue, styleLine);
		Plot(
			LineArray(	IIf(bTCZLong, aHPivIdxs[0], aLPivIdxs[0]),
			tcz618, curBar, tcz618, 0),
			"tcz618", colorPaleBlue, styleLine);
		Plot(
			LineArray(	IIf(bTCZLong, aHPivIdxs[0], aLPivIdxs[0]),
			tcz786, curBar, tcz786, 0),
			"tcz786", colorTurquoise, styleLine);
	}

// -- if (bShowTCZ)
}


// **************************
// END INDICATOR CODE
// **************************
_SECTION_END();

///********************************************//

flowerClose = EMA((Open+High+Low+Close)/4,3) ;
flowerOpen = EMA((Ref(Open,-1) + Ref(flowerClose,-1))/2,3);
Temp = Max(High, flowerOpen);
flowerHigh = EMA(Max(Temp, flowerClose),3);
Temp = Min(Low,flowerOpen);
flowerLow = EMA(Min(Temp, flowerClose),3);

//------------//


//#include <T3.AFL>;
_SECTION_BEGIN("Weekly_trend");

//AT=ParamColor("AT", colorRed );

Prd1=4; //Param("Weekly_Period1",4,1,200,1);
Prd2=5;// Param("Weekly_Period2",5,1,200,1);

TimeFrameSet (inWeekly);

TM   = T3  ( Close , Prd1 ) ;
TM2  = T3 ( Close , Prd2 ) ;
TimeFrameRestore();
BullishRevers=Close>TM AND Close<TM2;
Bullish=Close>TM AND Close>TM2;
BearishRevers=Close<TM AND Close>TM2;
Bearish=Close<TM AND Close<TM2;

Type1 = WriteIf( BullishRevers,"bullishrevers", "");
Type2 = WriteIf( Bullish,"bullish", "");
Type3 = WriteIf( BearishRevers,"bearishrevers", "");
Type4 = WriteIf( Bearish,"bearish", "");


RequestTimedRefresh( 0 );
GfxSelectFont( "Tahoma", 12, 100 );
GfxSetBkMode( 1 );
GfxSetTextColor( colorWhite );

if ( Type1 =="bullishrevers")
{
        GfxSelectSolidBrush( colorYellow );

}
else

if ( Type2 =="bullish")

{
      GfxSelectSolidBrush( ColorRGB(0,50,0));

}

else

if ( Type3 =="bearishrevers")

{
      GfxSelectSolidBrush( colorGrey40 );

}

else

if ( Type4 =="bearish")

{
      GfxSelectSolidBrush(  ColorRGB(50,0,0));

}


GfxSelectPen( colorTeal,2 );   // broader color
//GfxRoundRect( 2,320,150,200, 5, 5 );

GfxCircle( 70,90,60 );
_SECTION_END();


_SECTION_BEGIN("trending ribbon");

//BT=ParamColor("BT", colorRed );

TimeFrameSet (inDaily);
uptrend=PDI()>MDI()AND Signal()<MACD();
downtrend=MDI()>PDI()AND Signal()>MACD();
UTM3=IIf( uptrend, colorGreen, IIf( downtrend, colorRed, colorLightGrey ));

TimeFrameRestore();

UpA=uptrend;
DownB=downtrend;


Trend1 = WriteIf( UpA,"Up1", "");
Trend2 = WriteIf( DownB,"Down1", "");


RequestTimedRefresh( 0 );
GfxSelectFont( "Tahoma", 12, 100 );
GfxSetBkMode( 1 );
GfxSetTextColor( colorWhite );

if ( Trend1 =="Up1")
{
        GfxSelectSolidBrush( ColorRGB(0,70,0) );

}
else

if ( Trend2 =="Down1")

{
      GfxSelectSolidBrush(  ColorRGB(70,0,0));

}
else

if ( Trend2 =="")

{
      GfxSelectSolidBrush( colorPaleBlue );

}


GfxSelectPen( colorBlack, 0 );   // broader color
//GfxRoundRect( 15,305,135,215, 5, 5 );
GfxCircle( 70,90,54 );
_SECTION_END();


_SECTION_BEGIN("Trendslong");

//CT=ParamColor("CT", colorRed );

UpTrendCond3 = Cross ( T3( flowerclose, 7), T3( flowerclose, 9) );
dnTrendCond3 = Cross ( T3( flowerclose, 9),T3( flowerclose, 7) );


upt3= T3( flowerclose, 7)> T3( flowerclose, 9) ;
dnTrend3 = T3( flowerclose, 9)>T3( flowerclose, 7) ;


//for Trend1

Trendslongup= WriteIf(upt3,"trendlongup", "");
Trendslongdown= WriteIf( dnTrend3,"trendlongdn", "");
//Trendslongcon= WriteIf( UpTrendCond3,"trendlongcon", "");

if ( Trendslongup =="trendlongup")
{
        GfxSelectSolidBrush(ColorRGB(0,90,0) );

}
else

if (Trendslongdown =="trendlongdn")

{
      GfxSelectSolidBrush(  ColorRGB(90,0,0));

}

else

if (Trendslongdown =="")

{
      GfxSelectSolidBrush( colorYellow );

}

GfxSelectFont( "Arial", 10, 100 );
GfxSetBkMode( 1 );
GfxSetTextColor( colorBlack );

GfxSelectPen( colorBlack, 1 );   // broader color
GfxCircle( 70,90,48 );


_SECTION_END();


_SECTION_BEGIN("Trendsmid");

//DT=ParamColor("DT", colorRed );

UpTrendCond2 = Cross ( T3( flowerclose, 5), T3( flowerclose, 7) );
dnTrendCond2 = Cross (T3( flowerclose, 7), T3( flowerclose, 5) );
upt2= T3( flowerclose, 5)> T3( flowerclose, 7) ;
dnTrend2 = T3( flowerclose, 7)>T3( flowerclose, 5) ;


//for trend2

Trendmidup= WriteIf(upt2,"trendmidup", "");
Trendmiddown= WriteIf( dnTrend2,"trendmiddn", "");
Trendmidcon= WriteIf( UpTrendCond2,"trendmidcon", "");

if ( Trendmidup =="trendmidup")
{
        GfxSelectSolidBrush( ColorRGB(0,120,0) );

}
else

if (Trendmiddown =="trendmiddn")

{
      GfxSelectSolidBrush(  ColorRGB(120,0,0));

}

else

if (Trendmidcon =="trendmidcon")

{
      GfxSelectSolidBrush( colorYellow );

}

GfxSelectFont( "Arial", 10, 100 );
GfxSetBkMode( 1 );
GfxSetTextColor( colorBlack );

GfxSelectPen( colorBlack, 1 );   // broader color
GfxCircle( 70,90,42 );

_SECTION_END();

_SECTION_BEGIN("Trendsshort");

//ET=ParamColor("ET", colorRed );

UpTrendCond1 = Cross( flowerClose, T3( flowerClose, 5 ) );
dnTrendCond1 = Cross(  T3( flowerClose, 5 ),flowerClose );
upt1=flowerClose > T3( flowerClose, 5 ) ;
dnTrend1 = flowerClose< T3( flowerClose, 5 );


//for Trend1

Trendshortup= WriteIf(upt1,"trendup", "");
Trendshortdown= WriteIf( dnTrend1,"trenddn", "");
Trendshortcon= WriteIf( UpTrendCond1,"trendcon", "");

if ( Trendshortup =="trendup")
{
        GfxSelectSolidBrush( ColorRGB(0,150,0) );

}
else

if (Trendshortdown =="trenddn")

{
      GfxSelectSolidBrush(  ColorRGB(150,0,0));

}

else

if (Trendshortcon =="trendcon")

{
      GfxSelectSolidBrush( colorYellow );

}

GfxSelectFont( "Arial", 10, 100 );
GfxSetBkMode( 1 );
GfxSetTextColor( colorBlack );

GfxSelectPen( colorBlack, 1 );   // broader color
GfxCircle( 70,90,36 );


_SECTION_END();


_SECTION_BEGIN("Rays");

//FT=ParamColor("FT", colorRed );

Pp1=3;
Pp2=2;

CS33=HHV(LLV(flowerHigh,Pp1)-ATR(Pp2),4);
CR33=HHV(LLV(flowerHigh,Pp1)-ATR(Pp2),5);

AtrupTrendCond1 = flowerClose> CS33 ;
AtrdnTrendCond1 =CS33>flowerClose ;


ATRup = WriteIf(AtrupTrendCond1,"atrup", "");
 ATRdown= WriteIf( AtrdnTrendCond1,"atrdn", "");

if ( ATRup =="atrup")
{
        GfxSelectSolidBrush( ColorRGB(0,180,0) );

}
else

if (ATRdown =="atrdn")

{
      GfxSelectSolidBrush(  ColorRGB(180,0,0));

}

else

if ( ATRdown =="")

{
      GfxSelectSolidBrush( colorGrey40 );

}

GfxSelectFont( "Arial", 10, 100 );
GfxSetBkMode( 1 );
GfxSetTextColor( colorBlack );

GfxSelectPen( colorBlack, 1 );   // broader color
GfxCircle( 70,90,30 );

_SECTION_END();


_SECTION_BEGIN("Exit_Beast-3");

//GT=ParamColor("GT", colorRed );

EntrylookbackPeriod=10;
EntryATRperiod=1.9;
EntrySig = C > ( LLV( flowerLow, EntrylookbackPeriod ) + EntryATRperiod * ATR( 10 ) );
ExitSig = C < ( HHV( flowerHigh, EntrylookbackPeriod ) -EntryATRperiod  * ATR( 10 ) );


RequestTimedRefresh( 0 );
GfxSelectFont( "Tahoma", 12, 100 );
GfxSetBkMode( 1 );
GfxSetTextColor( colorWhite );

EntryB = WriteIf( EntrySig,"eu", "");
ExitB = WriteIf( ExitSig,"ed", "");

if ( EntryB =="eu")
{
        GfxSelectSolidBrush( ColorRGB(0,210,0) );

}
else

if ( ExitB =="ed")

{
      GfxSelectSolidBrush(  ColorRGB(210,0,0));

}

else

if ( ExitB =="")

{
      GfxSelectSolidBrush( colorGrey40 );

}

GfxSelectFont( "Arial", 10, 100 );
GfxSetBkMode( 1 );
GfxSetTextColor( colorBlack );

GfxSelectPen( colorBlack, 1 );   // broader color
GfxCircle( 70,90,24 );

_SECTION_END();


_SECTION_BEGIN("CCI9-2");

//HT=ParamColor("HT", colorRed );

ccidn=CCI(8) < 0;
cciup=CCI(9) > 0;


ccresult1 = WriteIf( cciup,"cu", "");
ccresult2 = WriteIf( ccidn,"cd", "");


RequestTimedRefresh( 0 );
GfxSelectFont( "Tahoma", 12, 100 );
GfxSetBkMode( 1 );
GfxSetTextColor( colorWhite );

if ( ccresult1 =="cu")
{
        GfxSelectSolidBrush( ColorRGB(0,240,0) );

}
else

if ( ccresult2 =="cd")

{
      GfxSelectSolidBrush(  ColorRGB(240,0,0));

}

else

if ( ccresult2 =="")

{
      GfxSelectSolidBrush( colorGrey40 );

}

GfxSelectFont( "Arial", 10, 100 );
GfxSetBkMode( 1 );
GfxSetTextColor( colorBlack );

GfxSelectPen( colorBlack, 1 );   // broader color
GfxCircle( 70,90,18 );


_SECTION_END();


_SECTION_BEGIN("%BB7-1");

//IT=ParamColor("IT", colorRed );
p=7;
x=((C+2*StDev(C,p)-MA(C,p))/(4*StDev(C,p)))*100;
bbdown= x < 40;
bbup= x > 40;

bbresult1 = WriteIf( bbup,"bu", "");
bbresult2 = WriteIf( bbdown,"bd", "");
bbresult3 = WriteIf( C,"bearishrevers", "");


RequestTimedRefresh( 0 );
GfxSelectFont( "Tahoma", 12, 100 );
GfxSetBkMode( 1 );
GfxSetTextColor( colorWhite );

if ( bbresult1 =="bu")
{
        GfxSelectSolidBrush( ColorRGB(62,255,62) );

}
else

if ( bbresult2 =="bd")

{
      GfxSelectSolidBrush( ColorRGB(255,62,62) );

}

else

if ( bbresult2 =="")

{
      GfxSelectSolidBrush( colorGrey40 );

}

GfxSelectFont( "Arial", 10, 100 );
GfxSetBkMode( 1 );
GfxSetTextColor( colorBlack );

GfxSelectPen( colorBlack, 1 );   // broader color
GfxCircle( 70,90,12 );


_SECTION_END();


_SECTION_BEGIN("Fast_trend");
//JT=ParamColor("JT", colorRed );

Prd3=5; //Param("Daily_Period1",8,1,200,1);
Prd4=8; //Param("Daily_Period2",15,1,200,1);
TimeFrameSet (inDaily);


TM3   = T3  ( C , Prd3) ;
TM4  = T3  ( C , Prd4) ;

TimeFrameRestore();

A=C>TM3 AND C<TM4;
B=C>TM3 AND C>TM4;
C=C<TM3 AND C>TM4;
D=C<TM3 AND C<TM4;

result1 = WriteIf( A,"bullrevers", "");
result2 = WriteIf( B,"bull", "");
result3 = WriteIf( C,"bearishrevers", "");
result4 = WriteIf( D,"bear", "");


RequestTimedRefresh( 0 );
GfxSelectFont( "Tahoma", 12, 100 );
GfxSetBkMode( 1 );
GfxSetTextColor( colorWhite );

if ( result1 =="bullrevers")
{
        GfxSelectSolidBrush( colorWhite );

}
else

if ( result2 =="bull")

{
      GfxSelectSolidBrush( ColorRGB(113,255,113) );

}

else

if ( result3 =="bearishrevers")

{
      GfxSelectSolidBrush( colorGrey40 );

}

else

if ( result4 =="bear")

{
      GfxSelectSolidBrush( ColorRGB(255,113,113) );
OP  = "M";

}

GfxSelectFont( "Arial", 10, 100 );
GfxSetBkMode( 1 );
GfxSetTextColor( colorBlack );

GfxSelectPen( colorBlack,1);   // broader color
GfxCircle( 70,90,6 );

//GfxTextOut( OP ,92,235) ;

_SECTION_END();
22 comments
Leave Comment
Please login here to leave a comment.
Back
Each circle is a one stand alone trading system, and there is a ten circle…
nice one
One of the greatest Afl ever released…..
One of the greatest Afl ever released…..
Hi, its looking like good AFL,
Guys can any one explain how to use this AFL. Like when to enter, when to exit. which time frame is good.
Thanks in advance.
Thnaks once again for sharing.
Waiting for ur replay
http://xtrator.wordpress.com/2012/05/21/nirvana/
in this website u will get the use of it………..
Thaks Kabir,
Nice info.
Good afl. Just need time to learn how to use it.
Just checked on 3min TF…really liked it so much…Thanku so much 4 a gr8 effort in making dis gr8 system….Im so happy at last…I got a system…which i can depend on trading…Thanku sir 1s again 4 dis rare find!
Hello sir could you please let me know when to buy and sell using this system
Excellent Graphics … I tried to do an " Exploration" but got “zilch” results. I use a standard format for exploration that work so would appreciate why this isn’t working with your program:
Thanks Kindly Dick Hoierman email “areehoi@yahoo.com”
As Kabir replied above , i jst went thru….“http://xtrator.wordpress.com/2012/05/21/nirvana/”
But i cudn’t find the time frame over ther,even how all(diffrnt 10 circles) circles show the trading system.
I hope being newbie will excuse & explain me the experienced fellow members.
What time frame i shud prefer for best outcome…hope i’ll get replied…by ny member ..
Hi Guys,
I dont have any programming knowledge in AFL.
I need one AFL only to display price in place of charts.
Just like nifty 5000 in place of chart. cos at a time im unable to track price in all charts. just i want to keep this chart in all windows.
Can any one give this small code to me.
Plz post ur code as comment.
I think this is small program.
Thanks in advance.
@hyraj
I checked with 5min and 15 min time charts. Its working fine.
This is the combination of 10 trading systems.
How i followed.
When i find green circles above 70% i placed buy order. and exited my positions when i found 40% red circles. Vice versa shorts. its working fine.
Guys plz advice.
@ madhavareddy1203, Thanks bro,
Thanks Madhava for yur reply,
As u said whn Green@70% Buy—30%Sell….
Do u mean, Green Circles 70% means when there are 7 Circles(Out of 10) are green
& Do u mean Green Circles 30% means when there are 3 Circles(Out of 10) are green
Plz explain, thanks in advance
~hyraj
@hyraj
Hi Bro.
What im saying when u found 70% green ( 7 out of 10) green then place buy order. After placing buy order if u found 60 % (6 out of 10)red circles then exit ur position.
means here green circles strength minimizing.
same for short. When u found 70% red Short. and exit ur position after found 60% green.
i hope this is clear.
Hi guys can any on help on above afl querry regarding price. (plz see 12th comment)
Thanks Madhava for yur valuable reply
~hyraj
*Can someone please tell me how to perform automatic analysis in amibroker on selected stocks for this formula and give alerts??
Thanks in advance.
Regards,
Abhi.*
I have tested,everything including foundation. This is the best system available so for.
there are 3 rules to use this system.After testing it live market,i selected the best time frame and rules. I wonder,how admin posted this afl without any restrictions.Hats off to MRTQ13.
use combination afl 1.rador afl 2. v.spikar afl
after that below guidlines follow.i got this guide lines by my friend
HOW TO READ THE CHART
buy:
1.if there is all or mostly green on circle
2.and bar color is white
3.and mov avg (those lines) mostly are below than price bar
4.and white dot(buy signal) appeare
5.and radar( macd) on blue mood
6.and volume spiker gives volume shadow
sell:
1.if there is all or mostly red on circle
2.and bar color is red
3.and mov avg (those lines) mostly are above than price bar
4.and red dot(sell signal) appeare
5.and radar( macd) on brown mood
6.and volume spiker gives no volume shadow
@Prakash2009
We are waiting for ur valuable feedback. Plz suggest time frame and results.
Thanks in advance
This is a wonderful creation of MRTQ13, who is the pioneer in creation and distribution his works without any hesitation.
Enjoy !!!
Dear AGOON sir,
am having and watching 2 afl ( AFL – COLLECTED FROM WISESTOCK TRADER )
am interested to combine the both and do little modification (confirmation of both arrows coming in same time) am not know coding knowledge, so pls help me sir.
thx. S.SURESH cell: 9842406366.