Stock Portfolio Organizer
The ultimate porfolio management solution.
Shares, Margin, CFD's, Futures and Forex
EOD and Realtime
Dividends and Trust Distributions
And Much More ....
WiseTrader Toolbox
#1 Selling Amibroker Plugin featuring:
Advanced Adaptive Indicators
Advanced Pattern Exploration
Neural Networks
And Much More ....
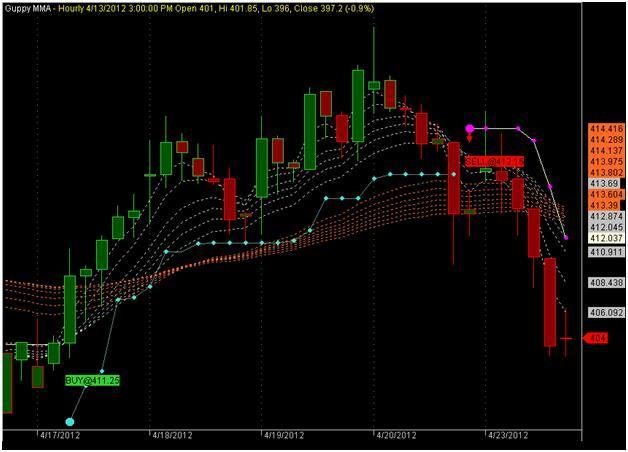
Guppy With KBrain Trending with Buy Sell Exploration for Amibroker (AFL)
Rating:
4 / 5 (Votes 3)
Tags:
trading system, amibroker, moving average
Guppy With KBreain Trending with Buy Sell Exploration
Screenshots
Similar Indicators / Formulas
Moving Average Pullbacks System
Submitted
by kaiji over 16 years ago
The Quest For Reliable Crossovers
Submitted
by Gorilabd almost 16 years ago
Guppy MMA Convergence Divergence Histogram
Submitted
by walid over 15 years ago
1453 Fatih
Submitted
by acarlar33 about 13 years ago
Golden Cross - conquest1453
Submitted
by acarlar33 about 13 years ago
Moving Average Difference
Submitted
by rananjay00007 about 16 years ago
Indicator / Formula
Copy & Paste Friendly
// ================AFL=========================
_SECTION_BEGIN("Brain Trend System");
SetChartBkColor(ParamColor("Panel color ",colorBlack));
//========================Initiation========================
bts=ParamToggle("BrainTrend1 signal","Yes|No" ,1);
btst=ParamToggle("BrainTrend1 stop","Yes|No" ,1);
btsl=ParamToggle("BrainTrend1 stop line","Yes|No" ,1);
period=Param("Period",13,2,21,1);
x1=53;
x2=47;
d=2.3;
f=7;
s=1.5;
range=ATR(f);
Range1 = ATR(f)/d;
Range2 = (ATR(f)*s)/4;
range3=ATR(10);
R = ((HHV(H,period) - C) /(HHV (H,period) -LLV (L,period))) *-100;
EMA1= EMA(R,Period);
EMA2= EMA(EMA1,5);
Difference= EMA1 - EMA2;
ZeroLagEMA= EMA1 + Difference;
value2=abs(ZeroLagEMA);


function PercentR( periods )
{
 return -100 * ( HHV( H, periods ) - C )/( HHV( H, periods ) - LLV( L, periods ) );
}


for( i = period+10; i < BarCount; i++ )
{
C[0]=0;
Value2[0]=0;
p[0]=0;
Plot1[0]=0;
Plot2[0]=0;
Val1=0;
Val2=0;
temp[0]=0;
Value3[0]=0;
tm[0]=0;
p1[i]=0;
bt1[0]=0;
bt2[0]=0;
r[0]=0;
bt1a[0]=0;
bt2a[0]=0;
istop[0]=Val1[0];
stop[i]=Val1[0];
bstop[0]=0;
sstop[i]=0;
//==================================Indicators============================
{
if (value2[i] < x2 AND abs(Close[i]-Close[i-2]) > range1[i])
 p[i] = 1 ;
else
{
if (value2[i] > x1 AND abs(Close[i]-Close[i-2]) > Range1[i])
 p[i] = 2 ;

else

 p[i]=0;
}
}

if ((value2[i] < x2 AND p[i] == 1) OR (value2[i] < x2 AND p[i] == 0))

{
if (abs(Close[i]-Close[i-2]) > Range1[i])
{
Plot1[i]=H[i];
Plot2[i]=L[i];
}
else
{
Plot1[i]=Plot1[i-1];
Plot2[i]=Plot2[i-1];
}
}
else
{
if ((value2[i] > x1 AND p[i] == 2) OR (value2[i] > x1 AND p[i] == 0))

{
Plot1[i]=L[i];
Plot2[i]=H[i];
}
else
{
Plot1[i]=Plot1[i-1];
Plot2[i]=Plot2[i-1];
}
}
//==================KBrain Signal ====================================
{
if (value2[i] < x2 AND (abs(Close[i]-Close[i-2]) > Range1[i]))
{
if (p[i] == 1 OR p[i] == 0)
Value3[i]=L[i]-range3[i];
val1[i]=Value3[i];
p[i]=1;
temp[i]=1;
}
else
{
temp[i]=temp[i-1];
}
{
if (value2[i] > x1 AND (abs(Close[i]-Close[i-2]) > Range1[i]))
{
if (p[i] == 2 OR p[i] == 0)
Value3[i]=H[i]+range3[i];
val2[i]=Value3[i];
p[i]=2;
temp[i]=2;;
}

}
}
{

if (temp[i]==1 AND Plot1[i]>0 AND tm[i] != 1)
 tm[i]= 1;

if (temp[i]==2 AND Plot2[i]>0 AND tm[i] != 2)
 tm[i]=2;

}
//===============================stop========================================
{
if (value2[i] < x2 AND (abs(Close[i]-Close[i-2]) > Range1[i])AND p[i] !=2)

   {
     value3[i]=L[i]-range3[i];
     va1[i]=Value3[i];
     p1[i]=2;
     r[i]=Va1[i];
     bstop[i]=Va1[i];
     bt2[i]=bt2[i-1];
     }

if (value2[i] > x1 AND (abs(Close[i]-Close[i-2]) > Range1[i])AND p[i] !=1)

     {
     Value3[i]=H[i]+range3[i];
     va2[i]=Value3[i];
     p1[i]=1;

     r[i]=Va2[i];
     sstop[i]=Value3[i];
     bt1[i]=bt1[i-1];
     }

  }


if (val1[i] == 0 AND val2[i] == 0 AND p[i] == 0 )
         {
         bstop[i]=bstop[i-1];
         sstop[i]=sstop[i-1];
         }


if (bstop[i]<bstop[i-1] AND tm[i]==1 AND tm[i-1]==1) bstop[i]=bstop[i-1];
if (sstop[i]>sstop[i-1] AND tm[i]==2 AND tm[i-1]==2) sstop[i]=sstop[i-1];

}
//=============================SYSTEM======================================
SetChartOptions(0,chartShowArrows | chartShowDates);
HaClose = (O + H + L + C)/4;
HaOpen = AMA( Ref( HaClose, -1 ), 0.5 );
HaHigh = Max( H, Max( HaClose, HaOpen ) );
HaLow = Min( L, Min( HaClose, HaOpen ) );
xDiff = (HaHigh - Halow) * 10000;
barcolor = IIf(HaClose >= HaOpen,colorLime,colorRed);
//PlotOHLC( HaOpen, HaHigh, HaLow, HaClose, "", barcolor, styleCandle );
PlotOHLC( Open, High, Low, Close, "", barcolor, styleCandle );
PlotShapes( shapeCircle* (bts AND tm==1 AND Ref(tm,-1)==2),colorTurquoise, 0, bstop, 0 );
PlotShapes( shapeCircle* (bts AND tm==2 AND Ref(tm,-1)==1), colorCustom12, 0, sstop, 0 );
PlotShapes( IIf(btst AND p==1,shapeSmallCircle,Null), colorTurquoise,0,bstop,0);
Plot(IIf(btsl AND tm==1,bstop,Null),"",colorPaleBlue,1);
PlotShapes( IIf(btst AND p==2,shapeSmallCircle,Null), colorCustom12,0,sstop,0);
Plot(IIf(btsl AND tm==2,sstop,Null),"",colorLightYellow,1);
Buy=Cover=(bts AND tm==1 AND Ref(tm,-1)==2);
Sell=Short=(bts AND tm==2 AND Ref(tm,-1)==1);
//SellPrice=ValueWhen(Sell,C,1);
//BuyPrice=ValueWhen(Buy,C,1);

Long=Flip(Buy,Sell);
Shrt=Flip(Sell,Buy );

//BuyPrice = ExRem(BuyPrice, SellPrice);
//SellPrice = ExRem(SellPrice, BuyPrice);

Buy = ExRem(Buy, Sell);
Sell = ExRem(Sell, Buy);

SellPrice=ValueWhen(Sell,C,1);ShortPrice=SellPrice;
BuyPrice=ValueWhen(Buy,C,1);CoverPrice=BuyPrice;


PlotShapes( IIf( Buy, shapeUpArrow, shapeNone ), colorGreen, layer = 0,yposition = HaLow, offset = -30);
//PlotShapes( IIf( Buy, shapeSmallCircle, shapeNone ), colorWhite, layer = 0,yposition = HaLow, offset = -8);

PlotShapes( IIf( Sell, shapeDownArrow, shapeNone ), colorRed, layer = 0, yposition = HaHigh, offset = -30);
//PlotShapes( IIf( Sell, shapeSmallCircle, shapeNone ), colorRed, layer = 0, yposition = HaHigh, offset = -8);

AlertIf( Buy, "SOUND C:\\Windows\\Media\\Chord.wav", "Audio alert", 2 );
AlertIf( Sell, "SOUND C:\\Windows\\Media\\Ding.wav", "Audio alert", 2 );


dist = 0.4*ATR(10);
for( i = 0; i < BarCount; i++ )
{
if( Buy[i] ) PlotText( "BUY@" + H[ i ], i, L[ i ]-dist[i], colorBlack , colorLime);
if( Sell[i] ) PlotText( "SELL@"+ L[ i ], i, H[ i ]+dist[i], colorBlack, colorRed);
}

_SECTION_END();


_SECTION_END();
//=================TITLE================================================================================================
_SECTION_BEGIN("Title");
_N(Title = StrFormat("{{NAME}} - {{INTERVAL}} {{DATE}} Open %g, Hi %g, Lo %g, Close %g (%.1f%%) {{VALUES}}", O, H, L, C, SelectedValue( ROC( C, 1 ) ) ));
_SECTION_END();


/*Guppy MMA */

SetChartBkColor(16);

_SECTION_BEGIN("Price");
SetChartOptions(0,chartShowArrows|chartShowDates);
ECw= EncodeColor(colorWhite);
ECy= EncodeColor(colorYellow);
_N(Title = ECw+ "Guppy MMA " +ECy+ StrFormat("- {{INTERVAL}} {{DATE}} Open %g, Hi %g, Lo %g, Close %g (%.1f%%) {{VALUES}}", O, H, L, C, SelectedValue( ROC( C, 1 ) ) ));
//Plot( C, "", IIf(Close > Open, colorBrightGreen, colorRed), styleBar | styleThick, styleNoTitle | ParamStyle("Style") | GetPriceStyle() );
_SECTION_END();


_SECTION_BEGIN("Fast Periods");
P13= EMA (C,13);
P1 = EMA(C,3);
P2 = EMA(C,5);
P3 = EMA(C,8);
P4 = EMA(C,10);
P5 = EMA(C,12);
P6 = EMA(C,15);
_SECTION_END();

_SECTION_BEGIN("Slow Periods");
S20 = MA(C,20);
P34 = EMA(C,34);

P7 = EMA(C,30);
P8 = EMA(C,35);
P9 = EMA(C,40);
P10 = EMA(C,45);
P11 = EMA(C,50);
P12 = EMA(C,55);
P13 = EMA(C,60);
_SECTION_END();

_SECTION_BEGIN("Guppy MMA");
Plot(P7,"",colorOrange,styleDashed = 32);
Plot(P8,"",colorOrange,styleDashed = 32);
Plot(P9,"",colorOrange,styleDashed = 32);
Plot(P10,"",colorOrange,styleDashed = 32);
Plot(P11,"",colorOrange,styleDashed = 32);
Plot(P12,"",colorOrange,styleDashed = 32);
Plot(P13,"",colorOrange,styleDashed = 32);

Plot(P1,"",colorLightGrey,styleDashed = 32);
Plot(P2,"",colorLightGrey,styleDashed = 32);
Plot(P3,"",colorLightGrey,styleDashed = 32);
Plot(P4,"",colorLightGrey,styleDashed = 32);
Plot(P5,"",colorLightGrey,styleDashed = 32);
Plot(P6,"",colorLightGrey,styleDashed = 32);
_SECTION_END();


Chg=Ref(C,-1);
MV15= Volume*100/MA(V,15);
DL = Ref(C,-20);


Vlp = 15;
VolAvg = MA( V, Vlp );
VolumeIdx = V / VolAvg;
Volbuy =  VolumeIdx >=2 AND O<C ;// > SmallWhiteCandle ;
Volsell = VolumeIdx >=2 AND O>C ;// > SmallBlackCandle ;

//Imm SLR = SL Diff points/Profits

Filter = ( Buy OR Sell);

mytimenum = DateTimeConvert( 1, DateTime() );

AddColumn(IIf( Buy,66,IIf(Sell,83,32) ),"A", formatChar, colorWhite, bkcolor =IIf(Buy, colorGreen,IIf( Sell,colorRed, colorDefault) ));//Action Trade buy or sell
AddColumn( IIf(Buy,H,IIf(Sell,-L,Null)) ,"PRICE",1.2,colorWhite,IIf(Buy,colorGreen,IIf(Sell,colorRed,colorBlack)));
AddColumn( VolumeIdx*100,"%Vol",1.1, colorBlack, IIf(Buy AND VolumeIdx > 1.8 ,colorGreen,IIf(Sell AND VolumeIdx > 1.8,colorRed,colorWhite))); // VOLUME INDEX
AddColumn( mytimenum,"TimeNum",colorBlack);
SetSortColumns(-6);

_SECTION_END();
//==============================================
0 comments
Leave Comment
Please login here to leave a comment.
Back